
Learning how to set up email alerts for server problems takes about an hour and a handful of built-in Linux tools. A small Bash script checks disk space, memory, load and service state on a schedule, then sends one email when a fault appears and another when it clears. No monitoring stack to install, no paid service to sign up for.
That last detail matters more than it sounds. The most common reason people never get told about an outage is not a missing feature, it is a broken mail path nobody tested until the day it mattered. So this guide puts delivery first, then the checks, then the schedule, and it shows you how to test each piece without taking anything offline.
The procedure is the same five steps whatever tool you use, whether that is a thirty-line script or Uptime Kuma or Grafana:
- Decide what counts as a problem. Disk, memory, load, failed services, expiring certificates, dead endpoints. Write the thresholds down before you write any code.
- Prove your mail transport works. Send a real test message from the same identity the alert script will use, and confirm it lands.
- Add the checks. One script, one exit code per check, one state file per check.
- Send on state change only. A problem that starts triggers one email. A problem that ends triggers one more.
- Schedule it and verify the failure path. Run it from cron or a systemd timer, then deliberately trip a threshold to confirm both the warning and the recovery email arrive.
If you only do steps two and five, you have already closed the gap that causes most missed incidents.
Table of Contents
- What You Need
- Step-by-Step
- Frequently Asked Questions
- Can I set up email alerts for server problems on Windows?
- What is the easiest way to send server alert emails through SMTP?
- Should server monitoring check local services or public endpoints too?
- How often should a server check for disk, CPU, and memory problems?
- How do I prevent the same server alert from being emailed repeatedly?
- When should I use Prometheus Alertmanager instead of a Bash monitor?
- Conclusion
What You Need
You need four things, and the first one is the one people skip. Before any code, confirm the server can send outbound mail at all.
- A Linux host. The commands below target Ubuntu 24.04 and any compatible systemd-based distribution. Debian, Rocky and Alma work the same way.
- Root or sudo access. You will write to
/etcand/var/lib, and the scheduler runs without an interactive login. - A working outbound mail method. Either a local mail transfer agent such as Postfix, or a relay you authenticate against. A local agent is simplest; authenticated SMTP is more reliable on a VPS.
- A destination address you genuinely read. Use a mailbox you check on a phone. An alert in an inbox you open on Tuesday has no operational value.
Two optional pieces pay for themselves. A second address, separate from your personal mail, keeps operational noise out of your main inbox. And a sending identity that matches the domain, something like [email protected], makes the message survive spam filtering. Generic from-addresses from a fresh mailbox are the first thing providers quietly drop.
Step-by-Step
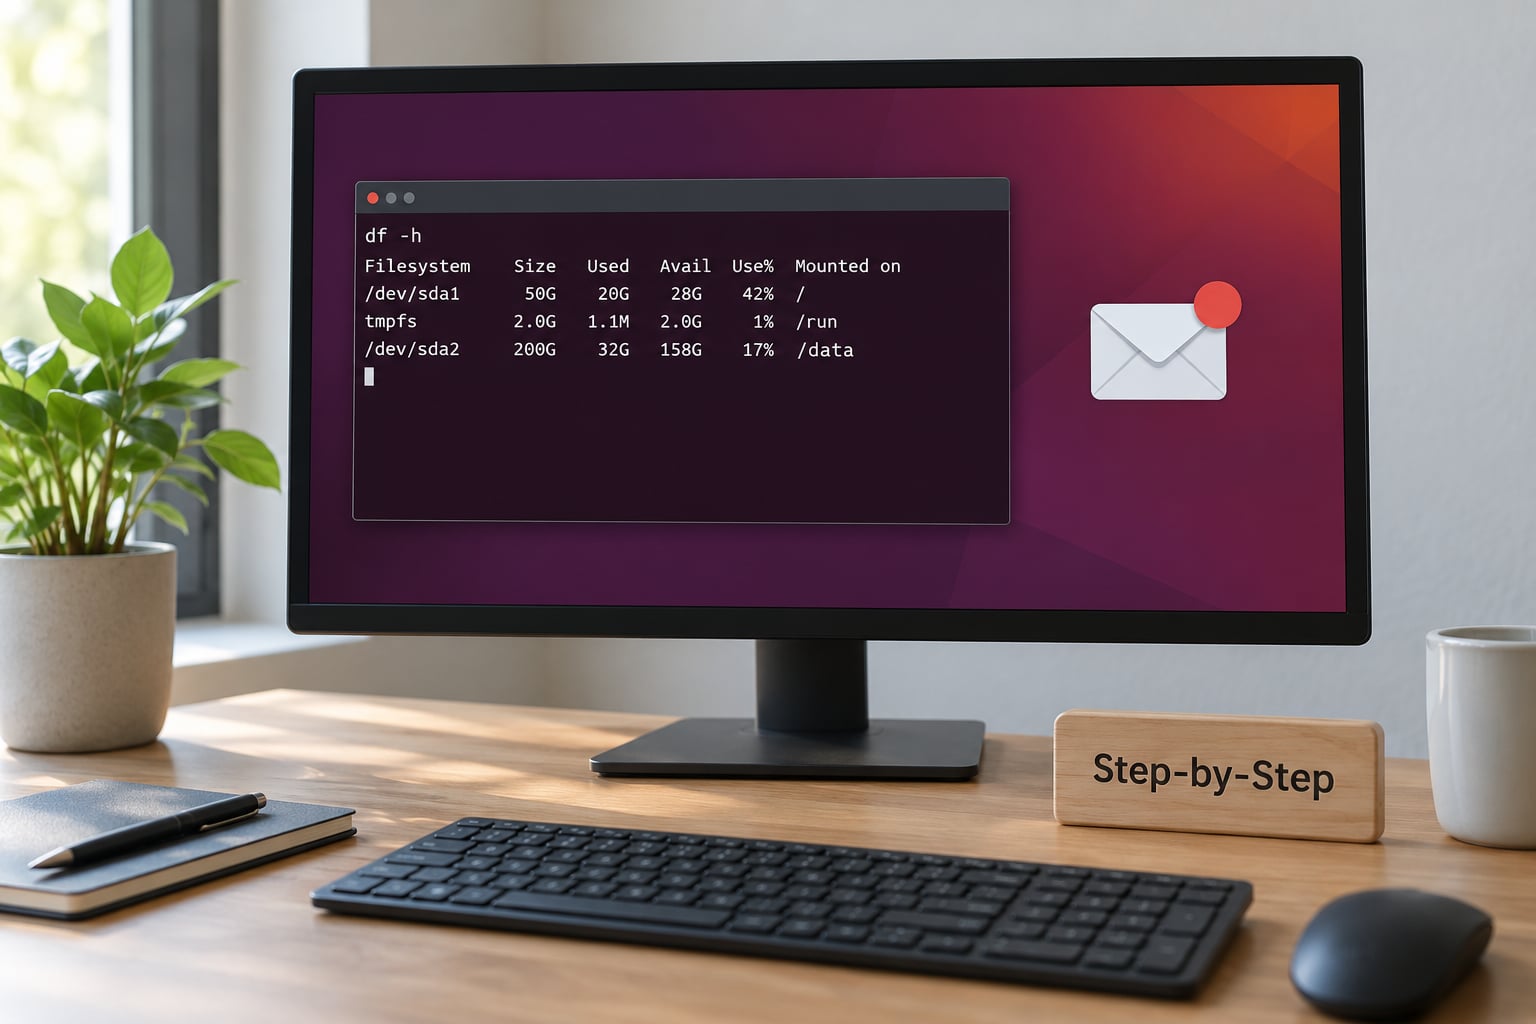
Choose what counts as a server problem, before you write any code
Start by naming the conditions worth an email. Most servers need four or five checks, not thirty, because a check you will not act on is just noise you will learn to skip.
Here is a sensible default set, with the thresholds I would use on a small VPS or homelab box:
| Condition | Warning | Critical | Why it matters |
|---|---|---|---|
| Root filesystem usage | 80 percent | 90 percent | A full root filesystem stops logs, updates and most services writing. |
| Memory usage | 90 percent sustained | Out of memory kills | One spike is normal, sustained pressure is not. |
| Load average, 1 minute | 2x core count | 4x core count | Catches runaway processes and swap thrash. |
| Failed systemd units | Any unit in failed state | Core service down | Catches a service that died overnight. |
| TLS certificate expiry | Under 14 days | Under 3 days | Expiry is a scheduled outage you can still prevent. |
| HTTP health endpoint | Two consecutive failures | Three consecutive failures | Catches a server that is up but broken. |
Decide now that alerts fire on state change, not on every failed run. A check that runs every fifteen minutes against a condition that stays true will otherwise send you ninety-six copies of the same message in a day. This is the single most repeated request in the forum threads on this topic: one email when the server goes down, one when it comes back, nothing in between.
Also decide what happens when everything is fine. Silence is ambiguous. Silence from a healthy server and silence from a broken notifier look identical from the outside, and the second one is the dangerous case. A daily heartbeat that only sends when everything passed closes that gap, which is the same idea behind a dead man’s switch.
Install and test a reliable email transport
The fix for alerts that never arrive is almost always this step, and it takes five minutes to prove. Install a small SMTP client that authenticates to your provider instead of relying on whatever the base image shipped with.
sudo apt update
sudo apt install -y msmtp msmtp-mta
Then write /etc/msmtprc. Values below are the common submission setup for a mailbox provider, not relay server configuration:
defaults
auth            on
tls             on
tls_starttls    on
tls_trust_file  /etc/ssl/certs/ca-certificates.crt
loglevel        1

account         default
host            smtp.yourprovider.com
port            587
from            [email protected]
user            [email protected]
passwordeval    "cat /etc/msmtprc.pass"

account default : default
Keep the password in a separate file with tight permissions, since the main config is often world-readable:
sudo sh -c 'printf "%s" "your-app-password" > /etc/msmtprc.pass'
sudo chmod 600 /etc/msmtprc.pass
sudo chmod 644 /etc/msmtprc
Now the part most guides skip. Send a real message and read it on another device:
printf 'Subject: monitor testnnIf you are reading this, delivery works.n' | sendmail -f [email protected] [email protected]
Did it arrive, and did it arrive in the inbox rather than spam? That single check is the difference between a monitoring setup that works and one you discover is broken during an incident. If it failed, the port and transport table below is the first place to look.
| Port | Transport | Use it when | Watch out for |
|---|---|---|---|
| 587 | STARTTLS | Submitting mail as a user to a mailbox provider | The default for most hosted email services and the safest general choice |
| 465 | Implicit TLS | Your provider documents it as the submission port | Some clients still try to issue STARTTLS on 465, which fails; match the provider docs |
| 25 | Plain relay | Server-to-server delivery from a mail server | Most VPS providers block outbound port 25 by default, and it is a spam signal when abused |
Two provider-specific notes save a lot of guessing. Gmail and Microsoft 365 both refuse plain-password login for automated senders, so generate an app password in the account security settings and use that instead of the account password. And on Microsoft 365 the connector often needs SMTP AUTH explicitly enabled for that mailbox, which is a tenant setting rather than something you control from the server.
Create the server monitoring script
To set up email alerts for server problems without a monitoring stack, write one script that reads its thresholds from the top, records state on disk, and mails only when that state changes. Put it at /usr/local/bin/server-monitor.sh:
#!/usr/bin/env bash
set -euo pipefail

DISK_WARN=80
DISK_CRIT=90
MEM_CRIT=90
LOAD_MULT=2
ALERT_TO="[email protected]"
ALERT_FROM="[email protected]"

STATE_DIR="/var/lib/server-monitor"
LOG_FILE="/var/log/server-monitor.log"

mkdir -p "$STATE_DIR"

notify() {
  # $1 severity, $2 check name, $3 detail
  local severity="$1" name="$2" detail="$3"
  printf '%s [%s] %s: %sn' "$(date -Is)" "$severity" "$name" "$detail" >> "$LOG_FILE"
  {
    printf 'From: %sn' "$ALERT_FROM"
    printf 'To: %sn' "$ALERT_TO"
    printf 'Subject: [%s] %s on %snn' "$severity" "$name" "$(hostname -s)"
    printf 'Host: %sn' "$(hostname -f)"
    printf 'When: %sn' "$(date -Is)"
    printf 'Detail: %sn' "$detail"
    printf 'Uptime: %sn' "$(uptime -p)"
  } | sendmail -f "$ALERT_FROM" "$ALERT_TO"
}

check() {
  # $1 name, $2 healthy exit code (0 good, non-zero bad), $3 detail text
  local name="$1" status="$2" detail="$3"
  local state_file="${STATE_DIR}/${name}"
  local previous="OK"

  [ -f "$state_file" ] && previous=$(cat "$state_file")

  if [ "$status" -ne 0 ]; then
    if [ "$previous" = "OK" ]; then
      printf 'PROBLEM' > "$state_file"
      notify "PROBLEM" "$name" "$detail"
    fi
  else
    if [ "$previous" = "PROBLEM" ]; then
      printf 'OK' > "$state_file"
      notify "RECOVERED" "$name" "condition returned to normal"
    fi
  fi
  return 0
}

cores=$(nproc)
disk_pct=$(df -P / | awk 'NR==2 {gsub("%","",$5); print $5}')
mem_pct=$(free -m | awk '/^Mem:/ {printf "%d", ($3/$2)*100}')
load1=$(awk '{print $1}' /proc/loadavg)
failed_units=$(systemctl --failed --no-legend --plain | wc -l)

if [ "$disk_pct" -ge "$DISK_CRIT" ]; then
  check disk 1 "root filesystem at ${disk_pct} percent (critical at ${DISK_CRIT})"
elif [ "$disk_pct" -ge "$DISK_WARN" ]; then
  check disk 0 ""
  [ -f "${STATE_DIR}/disk" ] || notify "WARNING" "disk" "root filesystem at ${disk_pct} percent"
  printf 'OK' > "${STATE_DIR}/disk"
else
  check disk 0 ""
fi

if [ "$mem_pct" -ge "$MEM_CRIT" ]; then
  check memory 1 "memory at ${mem_pct} percent"
else
  check memory 0 ""
fi

threshold=$(awk -v c="$cores" -v m="$LOAD_MULT" 'BEGIN {printf "%.2f", c * m}')
if awk -v l="$load1" -v t="$threshold" 'BEGIN {exit !(l > t)}'; then
  check load 1 "1 minute load ${load1} against threshold ${threshold}"
else
  check load 0 ""
fi

if [ "$failed_units" -gt 0 ]; then
  check services 1 "${failed_units} systemd unit(s) in failed state"
else
  check services 0 ""
fi

exit 0
Two details make the difference between a script you trust and one you mute. The state file per check, written only when the condition flips, is what turns a repeating failure into a single alert followed by a single recovery. And the exit code is forced to zero at the end so a failing check does not make the scheduler treat the whole run as broken and fire a second, redundant alert.
Keep the thresholds at the top rather than inline. When the disk warning turns out to be too tight for a box that writes verbose logs, you want a one-line change rather than a re-read of a hundred lines.
Run and verify each alert check
Run it by hand first, with the shell in front of you, so you can see every command output:
sudo chmod +x /usr/local/bin/server-monitor.sh
sudo /usr/local/bin/server-monitor.sh
echo "exit status: $?"
sudo tail -n 20 /var/log/server-monitor.log
A healthy server on a fresh run sends nothing and writes a line or nothing at all. That is correct behaviour, not a failure, and it is worth pausing on because it is the behaviour that produces one down email and one recovery email rather than a stream.
Now trip a threshold safely. Do not fill a real filesystem. Instead run a copy of the script with the numbers forced past the limits, or check a path that is already large, such as a mounted backup volume:
sudo DISK_CRIT=1 /usr/local/bin/server-monitor.sh
sudo cat /var/lib/server-monitor/disk
You should now have one problem email in your inbox and a state file reading PROBLEM. Run the exact same command a second time and confirm no second email arrives. That single test is what proves deduplication works before a real incident does it for you under pressure.
Then put the values back and run again. One recovery email should land, and the state file should read OK. If the warning arrives but the recovery does not, your state write is the problem, not your mail transport.
Schedule automatic checks with cron or a systemd timer
Run the check every five minutes on a single box, and pick a systemd timer rather than cron if you want the missed-run signal for free. The service unit:
# /etc/systemd/system/server-monitor.service
[Unit]
Description=Server health checks with email alerts
After=network-online.target

[Service]
Type=oneshot
ExecStart=/usr/local/bin/server-monitor.sh
The timer runs it on a five-minute cadence and drifts behind real time by design, so several hosts never fire at the same second:
# /etc/systemd/system/server-monitor.timer
[Unit]
Description=Run server health checks every five minutes

[Timer]
OnBootSec=2min
OnUnitActiveSec=5min
AccuracySec=30s

[Install]
WantedBy=timers.target
Enable it and confirm the next run time:
sudo systemctl daemon-reload
sudo systemctl enable --now server-monitor.timer
systemctl list-timers server-monitor.timer
The cron equivalent is a single line, but use the absolute path or cron will not find the script:
*/5 * * * * root /usr/local/bin/server-monitor.sh >/dev/null 2>&1
Four cron habits keep this reliable over years. Use absolute paths for the script and for every binary it calls. Redirect both output streams, because a stray line on stdout turns into a mail every five minutes. Avoid overlapping runs with a lock, in case one check ever hangs past the interval. And run the whole thing as a dedicated unprivileged user rather than root, since nothing in the script needs root.
Harden and maintain the setup
Keep the alert path boring and separate from everything else. Use a sending identity that exists only for this, revoke its app password without touching your mail settings if you ever suspect a leak, and store the credential in a root-only file rather than in the script. If you terminate TLS yourself, relay only to authenticated senders, otherwise your box becomes an open relay within a week of going live.
Give the log a size limit. An entry per state change is small, but heartbeats are not, and an unbounded log on a small VPS is a slow disk-full incident of its own. A short logrotate rule is enough:
/var/log/server-monitor.log {
    weekly
    rotate 4
    compress
    missingok
    notifempty
}
Review thresholds after the first month of real data rather than during the first incident. Disk warnings belong well below the level that actually breaks something, and a threshold tuned in a panic usually ends up permanently too tight. When you migrate the server, copy the state directory or delete it, otherwise the new host can inherit a stale PROBLEM file and stay silent about a real fault.
Know when the script is no longer enough. One server with four checks is a good fit for a script. Several hosts, long time series, on-call rotation and escalation policies want a real stack. Uptime Kuma gives you a web UI and a test button under Settings, Notifications. Grafana and Prometheus Alertmanager give you contact points, notification policies and routing trees. Zabbix and Nagios cover classic host and service checks. The SMTP section you just configured carries over unchanged, which is why it comes before the tooling question.
Common mistakes, and what to do about them
Almost every failure is one of a short list, and checking them in order is faster than guessing. Work down this table from the top.
| Symptom | Likely cause | Fix |
|---|---|---|
| No email at all, and no error anywhere | Transport silently dropping mail, or the script never ran | Run the script by hand, then send a plain test message. Check the timer or cron entry fired. |
| Test message never arrives | Blocked outbound port 25, wrong port for the provider, or SMTP AUTH disabled | Switch to 587 with STARTTLS, use an app password, ask the tenant admin to enable SMTP AUTH. |
| Email lands in spam | Generic from-address, missing SPF or DKIM, no matching reverse DNS | Send from a real domain address, publish SPF and DKIM, confirm the PTR record resolves to the host. |
| Same alert repeats every interval | The check fires on every failed run instead of on change | Track state per check and only notify on a flip, as the script above does. |
| Recovery email never comes | State file not cleared, or a reset value that never matches | Print the state file after a run and confirm it returns to OK. |
| Works interactively, fails on schedule | Relative paths and a minimal cron environment | Use absolute paths, set PATH in the unit file, and redirect both output streams. |
| Works at first, then stops | Provider rate limits or a per-day sending cap | Switch to a transactional relay, and confirm the daily cap covers your alert volume. |
| Containerised stack sends nothing | Network egress blocked, or DNS for the SMTP host unresolvable inside the container | Test connectivity from inside the container, add the resolver the host uses. |
| Alerts stop after a server reboot | Runtime path, such as a temp directory, no longer exists | Use absolute paths under /var/lib, and confirm the unit starts after network-online. |
Two more habits close most of the rest. Keep a monthly deliberate test, where you trip a threshold on purpose and confirm both emails arrive, because a monitor that dies quietly is worse than no monitor at all. And add a daily heartbeat that sends only on success, so silence always means something broke rather than meaning you got lucky.
Finally, protect against storms. A misconfigured check once produced dozens of messages in a few minutes before it was found. Give each alert a cooldown, cap the number of emails a check may send per hour, and keep a documented way to pause delivery in seconds when you are in the middle of planned maintenance.
Frequently Asked Questions
Can I set up email alerts for server problems on Windows?
Yes. On Windows Server, use PowerShell with the Send-MailMessage cmdlet or the System.Net.Mail classes, and trigger it from Task Scheduler on a repeating interval. A simpler route is a scheduled task that runs a PowerShell health check and mails you on failure. Windows Event Log entries can be forwarded to email too, using a lightweight collector or an event-driven scheduled task. The same state-file idea applies, so you get one email when a fault starts and one when it clears.
What is the easiest way to send server alert emails through SMTP?
Install msmtp on the host and authenticate to your mailbox provider on port 587 with STARTTLS, using an app password rather than the account password. That is usually a ten-minute job and it removes the class of problems caused by whatever mail agent the base image shipped with. Keep the password in a separate root-only file, and send from an address on a domain you control so SPF and DKIM checks pass.
Should server monitoring check local services or public endpoints too?
Do both, because they fail differently. Local checks catch disk, memory, load and dead processes, including problems that never reach the network layer. External checks against a public URL or API catch the failures locals cannot see: a bad DNS record, a firewall rule, an expired certificate, a failed deploy at the load balancer. When a local check passes and the public one fails, the fault is somewhere between the host and the internet.
How often should a server check for disk, CPU, and memory problems?
Every five minutes is a good default on a single host, and it is fast enough that an outage is obvious before anyone reports it. Memory and load are noisy, so a short window is more useful than a lower frequency there, since a thirty-minute check either misses short spikes or fires on normal bursts. For a larger fleet, keep the on-host checks frequent and let a central system deduplicate and group the results before anything reaches you.
How do I prevent the same server alert from being emailed repeatedly?
Send on state change rather than on every failed run. Store a state file per check, and email only when the value flips from healthy to faulty, then again when it flips back. A fifteen-minute check against a condition that stays true otherwise produces ninety-six identical messages a day, and that volume is how people learn to ignore the channel. Add a cooldown and a per-hour cap as a second layer of protection.
When should I use Prometheus Alertmanager instead of a Bash monitor?
Switch when you outgrow one host and a handful of checks. Alertmanager gives you grouping, inhibition, silences and maintenance windows, and it handles retry and delivery state properly when a receiver is down. It also assumes you already have metrics being scraped, which a script on a bare VPS does not produce. For a single box, a script plus a systemd timer is less to install and easier to reason about at three in the morning.
Conclusion
Start in this order and you will have working alerts tonight. Confirm the mail transport with a real test message you read on another device, then build the script around disk usage and failed services, the two checks with the clearest thresholds. Trip a threshold deliberately, confirm you get one problem email and one recovery email, and only then schedule it.
Once that loop is boring, add the rest: memory, load, certificate expiry and an external endpoint check. Review the thresholds a month later against real usage, keep a heartbeat that only sends on success, and the channel stays worth reading. That is how to set up email alerts for server problems in a way that survives contact with a real incident.