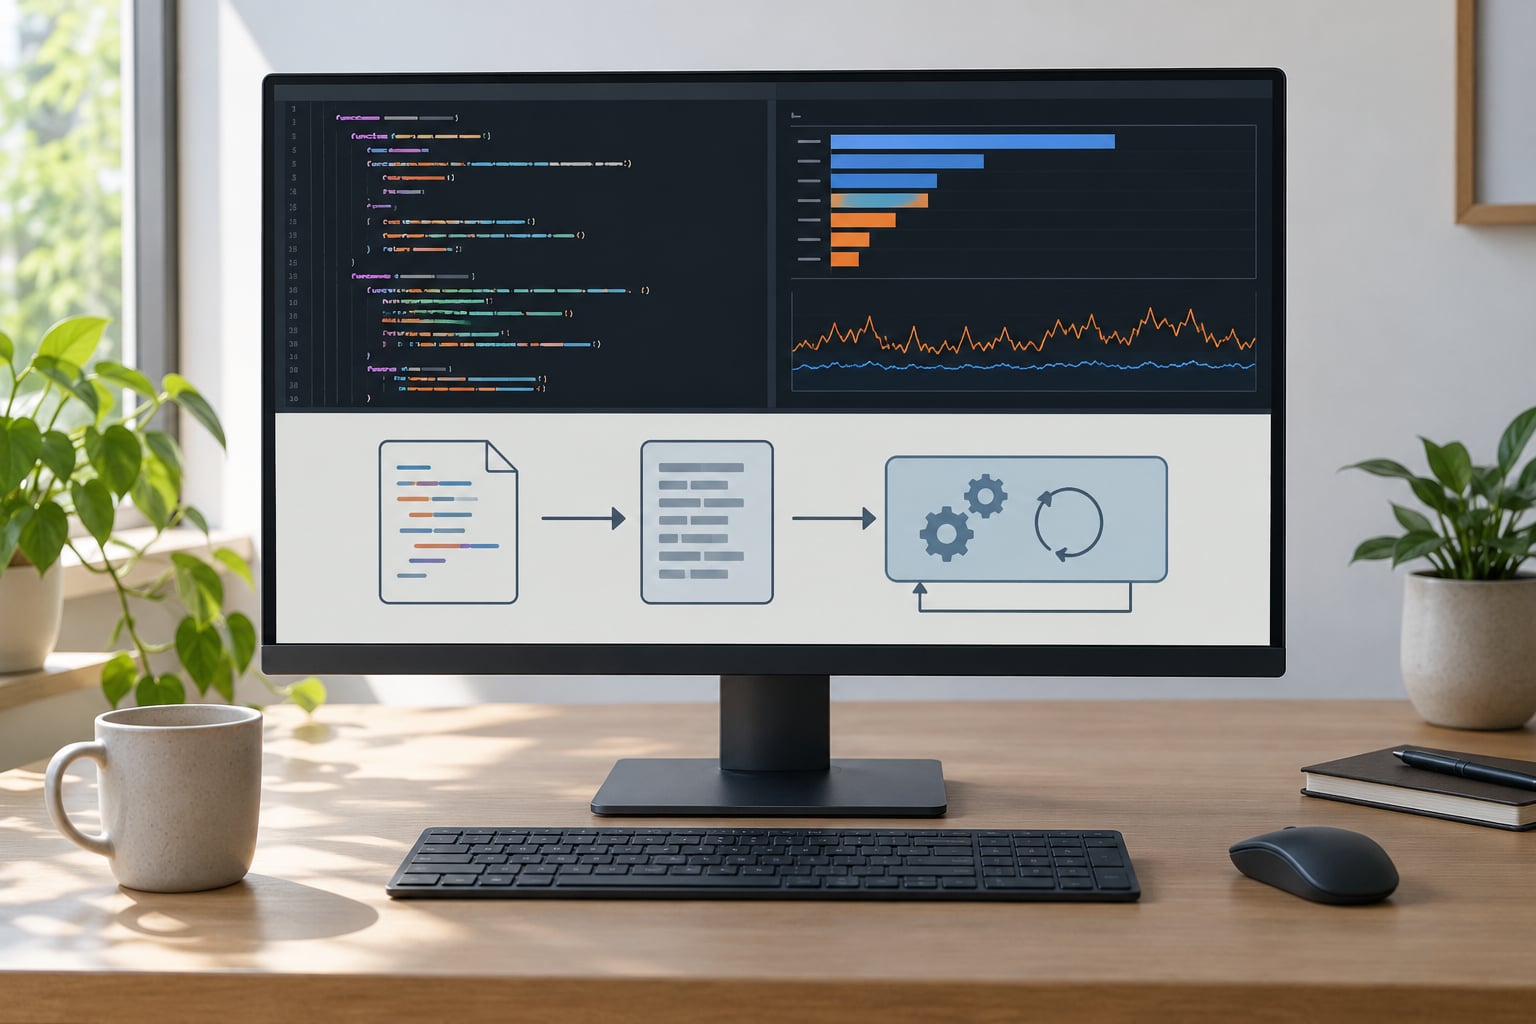
The short answer to why Python is slow and how to speed it up is fixed, per-operation cost. CPython compiles your source into bytecode, then walks that bytecode one instruction at a time, checks types at run time, manages every object’s memory, and holds a lock that lets only one thread run Python code at once. That overhead is real, but most slow Python programs are slow for ordinary reasons — a quadratic loop, a chatty database, work repeated inside a request — not because of the language itself. The fix is to measure first, then attack whichever cost actually dominates.
If you have arrived here from a script that took eight hours when you expected eight minutes, you are probably past the point of caring why the interpreter works the way it does. You want the path to faster code. Both halves are here: what makes Python expensive to run, then how to find and remove the expense in your program.
Table of Contents
- What Makes Python Slow?
- Why Python Is Slow in Real Programs
- How to Find the Real Bottleneck
- Start with a baseline you can repeat
- Read the cProfile output top-down
- Use line_profiler when cProfile is too coarse
- Use Scalene when CPU and memory fight each other
- Use py-spy on code you cannot easily restart
- Use timeit for single expressions, tracemalloc for growth
- How to Speed It Up Without Changing the Design
- How to speed up Python code when the slow part is your own logic
- How to Choose Faster Algorithms and Data Structures
- When to Use a Native Extension or Faster Runtime
- How to Speed Up Python Web and I/O Work
- Common Python Performance Mistakes
- Frequently Asked Questions
- Does Python have a JIT compiler?
- What is the GIL and how do I work around it?
- Is Python really 150x slower than C?
- Why is my Python script slow to start?
- Should I rewrite my slow Python code in C or Rust?
- What is the 80/20 rule for Python optimization?
- Conclusion
What Makes Python Slow?
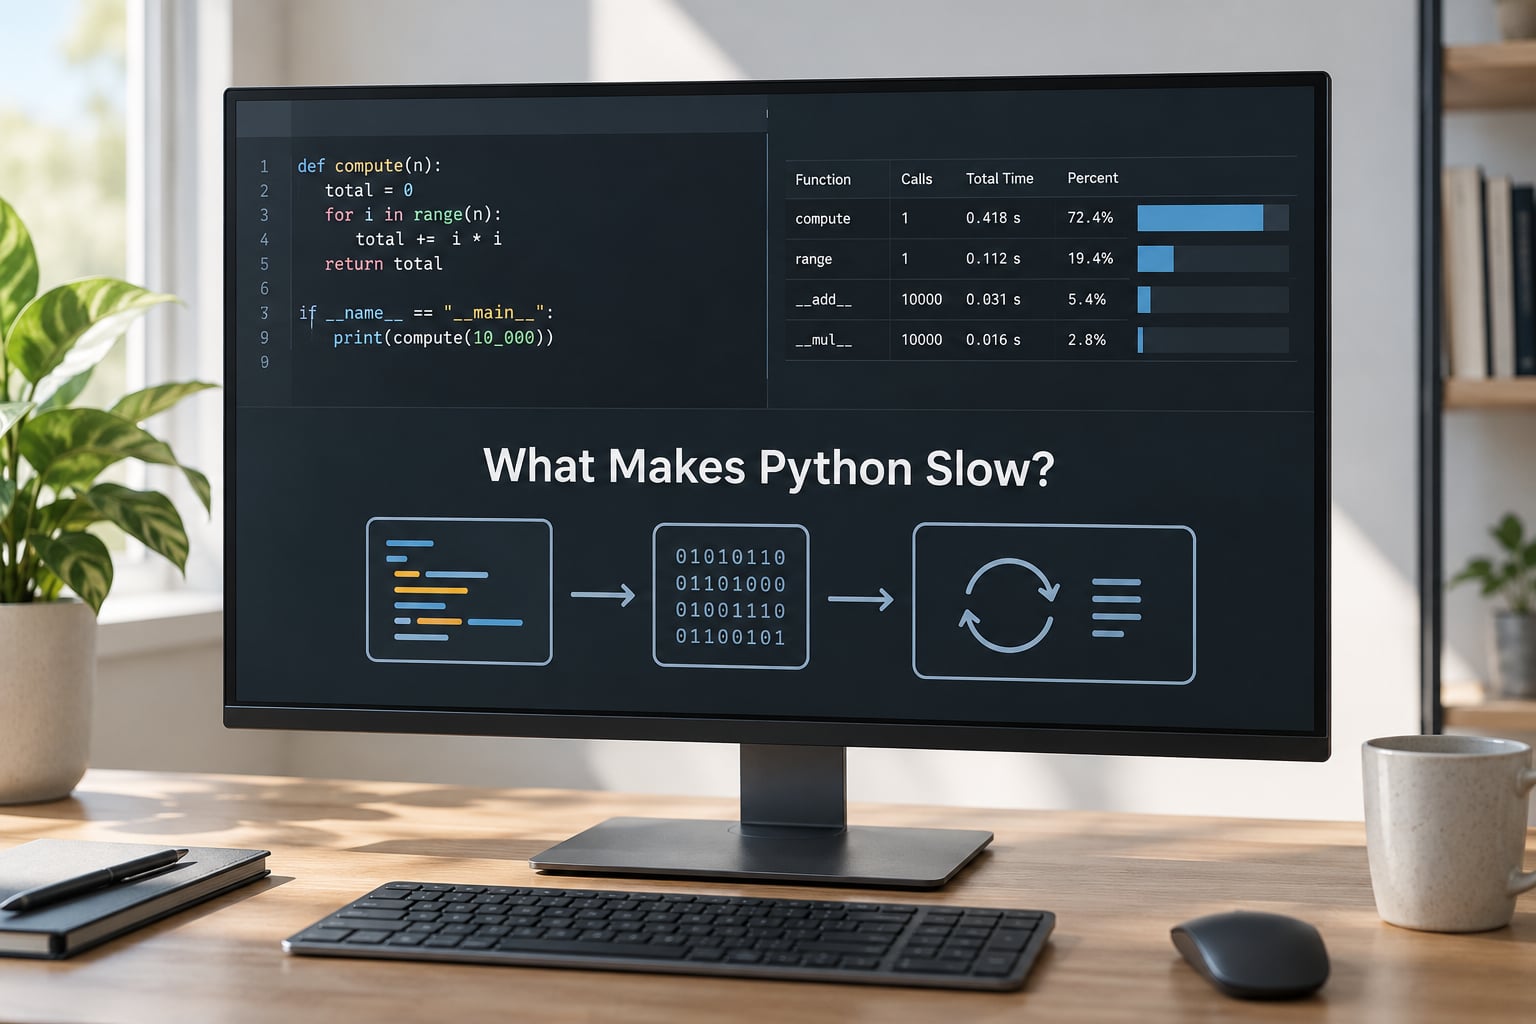
Being interpreted is the headline reason, and it is the least precise one. Python does compile your code — but to bytecode, which is instructions for a virtual machine, not instructions for your CPU’s hardware. A C or C++ compiler emits native machine code ahead of time, so the CPU runs it directly. Python’s interpreter loop reads each bytecode instruction, dispatches on it, and performs it as a C-level function call.
That means every arithmetic operation, every loop iteration, and every function call you write carries a fixed tax that a compiled language pays once at build time. The tax is small per operation and enormous in aggregate.
The pieces of that tax, roughly in the order they bite:
- Bytecode dispatch. Each instruction goes through the Python Virtual Machine’s fetch, decode and execute cycle.
- Dynamic typing. CPython evaluates types at run time rather than at compile time, so
a + bmight be an int, a string, or a NumPy array, and only the runtime knows. - No JIT in CPython. Just-in-time compilation is hard for a dynamic language, because the compiler cannot know a function’s argument types until it sees a call. PyPy solves this with a tracing JIT built specifically for Python.
- The Global Interpreter Lock. The GIL means one thread at a time executes Python bytecode in a process, so extra threads do not add CPU cores for CPU-bound work.
- Memory management. Every int, str and list is a heap object. Reference counting frees them immediately and a cyclic garbage collector sweeps up the rest; allocating and freeing millions of small objects is real work.
- Calls and attribute lookups. Calling a function builds a stack frame and resolves names through the dictionary-based namespace at run time.
Here is how that compares with the other common models. The point is not that Python is uniquely bad. It is that the overhead is per operation, so the shape of your program matters far more than the language label.
| Language | What happens to your code | Where the cost sits |
|---|---|---|
| C, C++ | Compiled straight to native machine code ahead of time | Build time; almost nothing at run time |
| Java, C# | Compiled to bytecode, JIT-compiled by the runtime into native code | Startup warmup, then native speed |
| CPython | Compiled to bytecode, interpreted by the Python Virtual Machine | Every single operation |
| PyPy | Compiled to bytecode, JIT-compiled while running | First executions are slow, then it gets fast |
Two differences explain almost everything people mean by “interpreted versus compiled.” First, compilation turns your source into another program before execution rather than during it. Second, a compiler can specialize aggressively because it sees every use of a function, while an interpreter has to handle whatever type turns up in each call.
Why Python Is Slow in Real Programs
The language costs are constant. The costs that actually ruin your afternoon are application-level, and they fall into a short list.
Repeated work inside a loop. Recomputing an expensive value on every iteration when it depends on nothing that changes. Hoist it out. This one shows up in almost every slow script I have profiled.
The wrong complexity class. A membership test against a list inside a loop is O(n) per lookup, so scanning a million records becomes O(n²). A set makes the same test O(1) and turns billions of comparisons into millions.
Object churn. Building a million-element list by appending, or copying a list every iteration, burns time in the allocator and the garbage collector rather than in your logic.
Serial I/O. Reading fifty files one after another wastes almost all of the run waiting on disk. The same applies to per-row database queries and one HTTP request per item.
Work in the request path. A web handler that recomputes a report per request will look like a slow web framework. It is a slow function, called far too often.
And here is the part that catches people: for most applications, the bottleneck is not Python. It is a network round trip, a disk seek, a lock, or a query plan. A Python function taking 40 milliseconds inside a request that spends 900 milliseconds waiting on the database means making the function ten times faster changes almost nothing. Decide which side of that line you are on before optimizing anything.
How to Find the Real Bottleneck
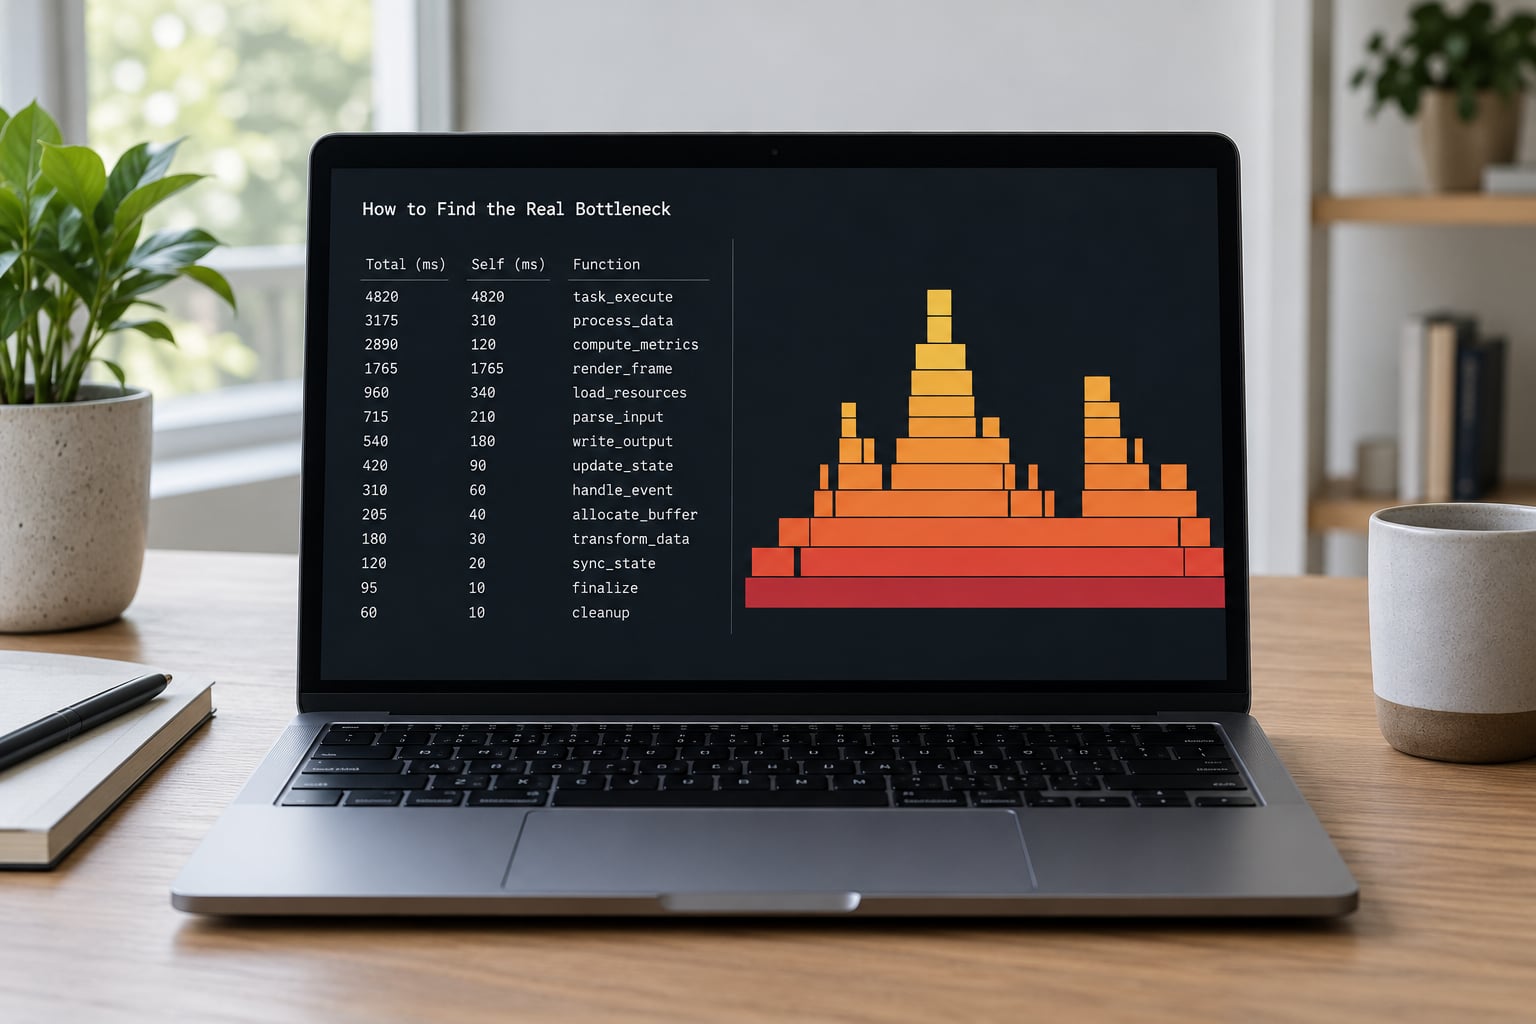
Guessing at bottlenecks wastes weeks. The fix is a repeatable loop: measure, change one thing, measure again, keep or revert. These are the tools that make it ten minutes instead of ten days.
Start with a baseline you can repeat
Time the whole script once with the real dataset and note the total, the machine, and the Python version. Anything you change after that is measured against a number you can point back to.
python -X importtime app.py
python -m cProfile -s cumulative app.py
The first command shows which imports are costing you at startup, which is the forgotten cause of “my script takes eight seconds to print hello.” The second gives you the profile.
Read the cProfile output top-down
Sort by cumulative time and ignore the flat list at the bottom unless the top of it looks suspicious. Find the highest cumulative number, read the callers listed underneath it, and follow the tree down to the one function eating the time.
python -m cProfile -s cumstats app.py | head -30Two columns matter. Cumulative is the total time inside a function including everything it calls; tottime is time in that function alone. A function with huge cumulative time and small tottime is a router — fix whatever it calls. A function with high tottime is doing the slow work itself.
Use line_profiler when cProfile is too coarse
cProfile counts calls, not lines, so one slow function full of fast lines looks fine. line_profiler times each line inside a single function and is the tool for “this function is 40 seconds, now which line?”
Use Scalene when CPU and memory fight each other
Scalene separates CPU time from memory allocation time and reports the fraction of time a program spends copying or freeing memory. That split explains a specific and common failure: a job that is not compute-bound at all but spends much of its run in the allocator.
Use py-spy on code you cannot easily restart
py-spy samples a running process and draws a flame graph without changing a line or restarting anything. For production services and long batch jobs this is the fastest path to an answer, and you can point it at a process ID on the box.
Use timeit for single expressions, tracemalloc for growth
timeit answers “how long does this one operation take” with enough repetitions to be meaningful. tracemalloc or memory_profiler answers “where did that memory go.” Do not micro-benchmark with time.time() around a single call; the timer overhead and the warm-up will mislead you.
Your success signal is simple: after each change, the baseline number moves in the direction you wanted, and you can name the line of the profile that changed.
How to Speed It Up Without Changing the Design
These fixes keep your architecture intact, which means they are cheap to adopt and cheap to revert. Work down this list in order of payoff per hour spent.
How to speed up Python code when the slow part is your own logic
Replace hand-written loops with built-ins that already run in C. The rule of thumb from the Python community is blunt: if a standard-library function does the job, your loop is a worse version of it.
# slow: builds a new list every iteration
result = []
for x in data:
    result.append(transform(x))

# faster: no repeated attribute lookup, one pass
result = [transform(x) for x in data]

# faster still when the transform is a single named function
from operator import itemgetter
rows.sort(key=itemgetter("total"))sorted, min, max, sum, any, all and zip all run in C and beat an equivalent Python loop by a wide margin. Bind methods once outside the hot loop rather than looking them up on every pass:
# attribute lookup happens on every pass
for row in rows:
    row.calculate_total()

# lookup happens once
calc = Row.calculate
for row in rows:
    calc(row)
Batch your I/O. Read files in a thread or process pool, fetch with a session that reuses connections instead of opening a new one per request, and write results in chunks rather than one write() per record. Serialize once, not once per field.
Use generators when the data does not fit in memory. A generator expression over ten million rows keeps one row live at a time, where a list comprehension holds all ten million. The trade-off is that generators cannot be indexed or reused, so use them for streaming and not for repeated access.
Reach for functools.lru_cache when a pure function returns the same answer for the same input. It is a few lines of code and routinely saves minutes of recomputation. Cache only immutable arguments, and clear the cache when your underlying data changes.
Know your standard library. itertools gives you lazy, C-level combinators for grouping, chunking and permutation; collections.deque gives O(1) appends and pops from both ends; math and statistics give faster versions of things you would otherwise loop over.
How to Choose Faster Algorithms and Data Structures
Every fix above is a rounding error next to picking the right structure. This is the change that turns a two-hour job into a two-minute one, and it is also the change most often missed.
| Operation | Slow choice | Fast choice | Why |
|---|---|---|---|
| Is this item present? | item in list | item in set | O(n) becomes O(1) |
| Count occurrences | dict loop | collections.Counter | C-level counting |
| Look up by key | list of pairs | dict | Hash lookup, not a scan |
| Find index in sorted data | linear scan | bisect | O(log n) |
| Take the largest k items | sort everything | heapq.nlargest | O(n log k) |
| Pop from the front | list.pop(0) | collections.deque | Avoids copying the list |
| Numeric work on arrays | Python loop | NumPy or Polars | Work leaves the interpreter |
Vectorizing is the biggest single win in data work, and users on r/Python and Stack Overflow say the same thing about it: moving numeric loops into NumPy or Polars arrays is where the largest real-world gains come from. The interpreter handles a few dozen array operations instead of millions of element operations.
For large integer work, also consider array and memoryview from the standard library, which store numbers without per-object overhead, and __slots__ on classes with fixed attributes, which removes a per-instance dictionary. Those two cut memory a lot and cut attribute lookup time a little.
When to Use a Native Extension or Faster Runtime
Once you have measured, there are four escalations. Each buys real speed and costs real complexity, so move up one rung only.
C extension modules. NumPy, pandas and cryptography are all C underneath. If your hot path is numeric, you can often get native speed by using the right C-backed library instead of writing your own extension. Writing a raw C extension yourself is the biggest jump in build and debugging pain in this list.
Cython. You annotate your existing Python code with types and compile it to C. The attractive part is that most of your code stays readable. The cost is a build step that has to work on every machine and CI runner that touches the project.
Numba. Decorate a numeric function and it JIT-compiles just that function. Excellent for numeric kernels, awkward for string handling, object-heavy logic or anything with irregular control flow.
A different runtime. PyPy runs a JIT that gets faster the longer it runs, which suits long-lived services and heavy loops; it is weak on C-extension compatibility. Free-threaded CPython builds, available as an opt-in install since Python 3.13, remove the GIL so threads use multiple cores, at a cost to single-threaded performance that varies by workload.
The non-Python rung exists too. If a hot loop in Python is one percent of your runtime, rewriting it in Rust or C buys nothing. If it is ninety percent and profiling has confirmed it, a small native module is a fine answer and a full rewrite usually is not.
How to Speed Up Python Web and I/O Work
Most production Python is waiting, not computing. That changes which optimizations pay.
Threads are for waiting. Threading lets you overlap I/O-bound work, and the GIL does not stop that, because the thread is released while blocked on the socket. It gives you nothing for CPU-bound work.
asyncio is for many concurrent sockets. One event loop handling thousands of waiting connections uses far less memory than a thread per request. It costs you a rewritten control flow, so it suits new services more than old ones.
multiprocessing is for CPU. Separate processes have separate interpreters and separate GILs, so they scale across cores. The cost is memory, serialization between processes, and a debugging experience that is much worse.
Reuse connections. A new TCP connection plus TLS handshake per request is frequently the largest cost in an API client. Keep a session or a connection pool open.
Stop the N+1 query. Fetching related rows one at a time scales linearly with your table. Join, batch, or use an IN clause.
Cache deliberately. Cache reads that change rarely, use TTLs so a deploy does not serve stale data forever, and invalidate on write. Cache a query you never measured and you have added a memory leak with extra steps.
Stream large payloads. Return generators or file-like objects rather than building one giant response in memory. Set explicit connect and read timeouts so a hung peer cannot hold a worker forever.
Common Python Performance Mistakes
Every one of these is advice that shows up in tip lists and causes damage in real projects.
Optimizing before profiling. The most repeated forum advice, and the most repeated failure. You will spend your effort on code that was never the problem.
Turning every loop into a comprehension. A comprehension is not always faster than a plain loop with a clear body, and after three chained filters it stops being readable. Speed is a reason, not the only reason, to write one.
Caching mutable objects. Handing out the same list or dict from a cache means one caller’s in-place edit shows up in someone else’s result. Return a copy, or cache only immutables.
Spinning up a process pool for a one-second job. Spawning workers costs more than the work. Use a pool when the job is long enough to amortize it.
Using threads to escape the GIL. For CPU-bound work, threads interleave and finish at about the same total time. Use processes or native code.
Expecting a new runtime to fix a bad algorithm. A JIT makes fast code faster. If the complexity is wrong, no interpreter changes the growth curve.
Ignoring import and startup cost. A CLI that pulls in a large framework to do one small job will feel broken even though its compute is fine. Check python -X importtime and see whether you need the import at all.
Tuning inside functions when globals are the cost. Names resolve fastest as locals, which is why code sometimes runs faster once wrapped in a function. This matters in a genuine hot loop and nowhere else.
Frequently Asked Questions
Does Python have a JIT compiler?
CPython does not. It compiles your source to bytecode and interprets that bytecode, with no just-in-time compilation step. PyPy does ship a tracing JIT that compiles hot functions to native code while your program runs, which is why long-running PyPy programs can eventually beat CPython. Free-threaded CPython builds from 3.13 remove the GIL but are still not JIT-compiled. If raw speed matters most and your code is numeric, a C-backed library beats a JIT anyway.
What is the GIL and how do I work around it?
The Global Interpreter Lock is a mutex inside each Python process that allows only one thread to execute bytecode at a time. It simplifies memory management, and it stops threads from adding cores to CPU-bound work. The options are multiprocessing, which gives each worker its own interpreter and GIL; native extensions that release the GIL or avoid it; Cython or Numba for hot numeric code; or a free-threaded CPython build from 3.13, where the GIL is optional. For I/O-bound work, threads are already fine.
Is Python really 150x slower than C?
That figure comes from a decades-old micro-benchmark of a tight numeric loop, not from real applications, and it is quoted far more often than it is measured. Modern CPython is far faster than the versions that benchmark was written against, and typical programs spend much of their time waiting on the network, disk or a database, where language choice barely registers. Measure your own workload with timeit or cProfile on your data before you believe any ratio, including faster-looking ones.
Why is my Python script slow to start?
Startup cost is usually imports. Run python -X importtime yourscript.py and you get the cost of every module loaded, in order. Heavy frameworks and scientific libraries can add seconds before your first line runs. Fixes are lazy-importing expensive modules inside the function that needs them, importing only the submodules you use, deferring framework startup until after argument parsing, and packaging CLI tools as a zipapp instead of a directory. This axis is separate from runtime speed and optimizing loops will not change it.
Should I rewrite my slow Python code in C or Rust?
Profile first and find out what share of the runtime that code actually is. If the hot function is under ten percent, a rewrite buys you almost nothing and costs you a build system, a debugging story and a second language on the team. If it is ninety percent, keep it small, put a thin native module behind a Python interface, and leave the rest alone. A full rewrite is usually the wrong move; a targeted native function is often the right one.
What is the 80/20 rule for Python optimization?
It means roughly twenty percent of your code is responsible for about eighty percent of the run time, so effort belongs on that twenty percent and nowhere else. In practice the pattern repeats: one quadratic loop, one chatty database call, or one oversized data structure is usually the whole problem. Find it with cProfile or py-spy, fix it, and stop. Optimizing the other eighty percent of the code for readability is not a performance failure, it is the correct outcome.
Conclusion
Why Python is slow comes down to per-operation interpreter work, runtime type checking, constant memory management and the GIL. That tells you where wins live: reduce the number of Python-level operations, move the work out of the interpreter, or spread it across cores.
So start with the slow path itself. Time it, profile it, find the one function or one I/O call that dominates, and fix that first — usually an algorithm, a data structure or an architecture problem. The syntax-level speedups in this guide are worth real time, but they are the second move, not the first.