
To monitor a home server with Grafana, you need three pieces: Prometheus as the database, Node Exporter as the metrics agent on every machine you want to watch, and Grafana as the dashboard layer on top. Prometheus scrapes each exporter’s /metrics endpoint on a timer, Grafana turns those numbers into graphs using PromQL, and alerts fire when a threshold breaks.
All three are free, and the whole stack runs happily on a Pi 4 or an old mini PC. Expect about an hour for the first working dashboard, mostly spent copying config and waiting for a scrape cycle. Updated for 2026, with the Debian and Ubuntu commands called out explicitly and a Docker-free path for anyone who would rather not run containers.
Table of Contents
- What You Need
- Step-by-Step: How to Monitor a Home Server with Grafana
- Install and configure the monitoring stack
- Create a useful home-server dashboard
- Add alerts for failures and resource pressure
- Secure and maintain the setup
- Common Mistakes
- Frequently Asked Questions
- Can I monitor multiple home servers with one Grafana instance?
- Can a Raspberry Pi run Grafana and Prometheus for a home lab?
- Do I need cAdvisor to monitor Docker containers?
- How do I get alerts when a service goes down at home?
- How do I tell a host failure apart from an application failure?
What You Need
The examples below assume Ubuntu or Debian with systemd. Fedora and RHEL family machines use the same logic with dnf instead of apt, and the service names stay the same.
- A host to run Grafana and Prometheus on. Any 2-core machine with 2 GB of free RAM works. A Raspberry Pi 4 handles two or three monitored hosts fine, though you will want a 15 second scrape interval rather than 5.
- Static IPs or stable hostnames for each machine you want to monitor. DHCP reservations are enough; do not rely on addresses changing under you.
- Outbound-free network access between machines — Prometheus pulls, so every exporter must be reachable from the Prometheus host on its own port.
- Three packages:
prometheus,grafanaandprometheus-node-exporter(namednode_exporteron the exporter host). - Root or sudo access for the install, and a non-login service account to run the exporters afterwards.
Ports are the part people miss. Get these open between your monitoring host and the monitored machines, and nothing else needs to be reachable:
| Service | Default port | Runs on | Purpose |
|---|---|---|---|
| Grafana | 3000 | Monitoring host | Dashboards and alert UI |
| Prometheus | 9090 | Monitoring host | Time-series database and rules |
| Node Exporter | 9100 | Each monitored host | Linux CPU, memory, disk, network |
| cAdvisor | 8080 | Docker hosts | Per-container metrics |
| windows_exporter | 9182 | Windows hosts | Windows performance counters |
| Alertmanager | 9093 | Monitoring host | Routes fired alerts to email, Slack or Discord |
A sensible resource budget: Grafana sits around 200–400 MB of RAM, Prometheus commonly lands between 300 MB and 1 GB depending on how many targets and how long you retain data. Several people in r/selfhosted have posted that the full stack felt like overkill for a two-machine lab and moved to something lighter, which is fair — if you only want “is it up” checks, a single uptime monitor does that job without a database.
Step-by-Step: How to Monitor a Home Server with Grafana
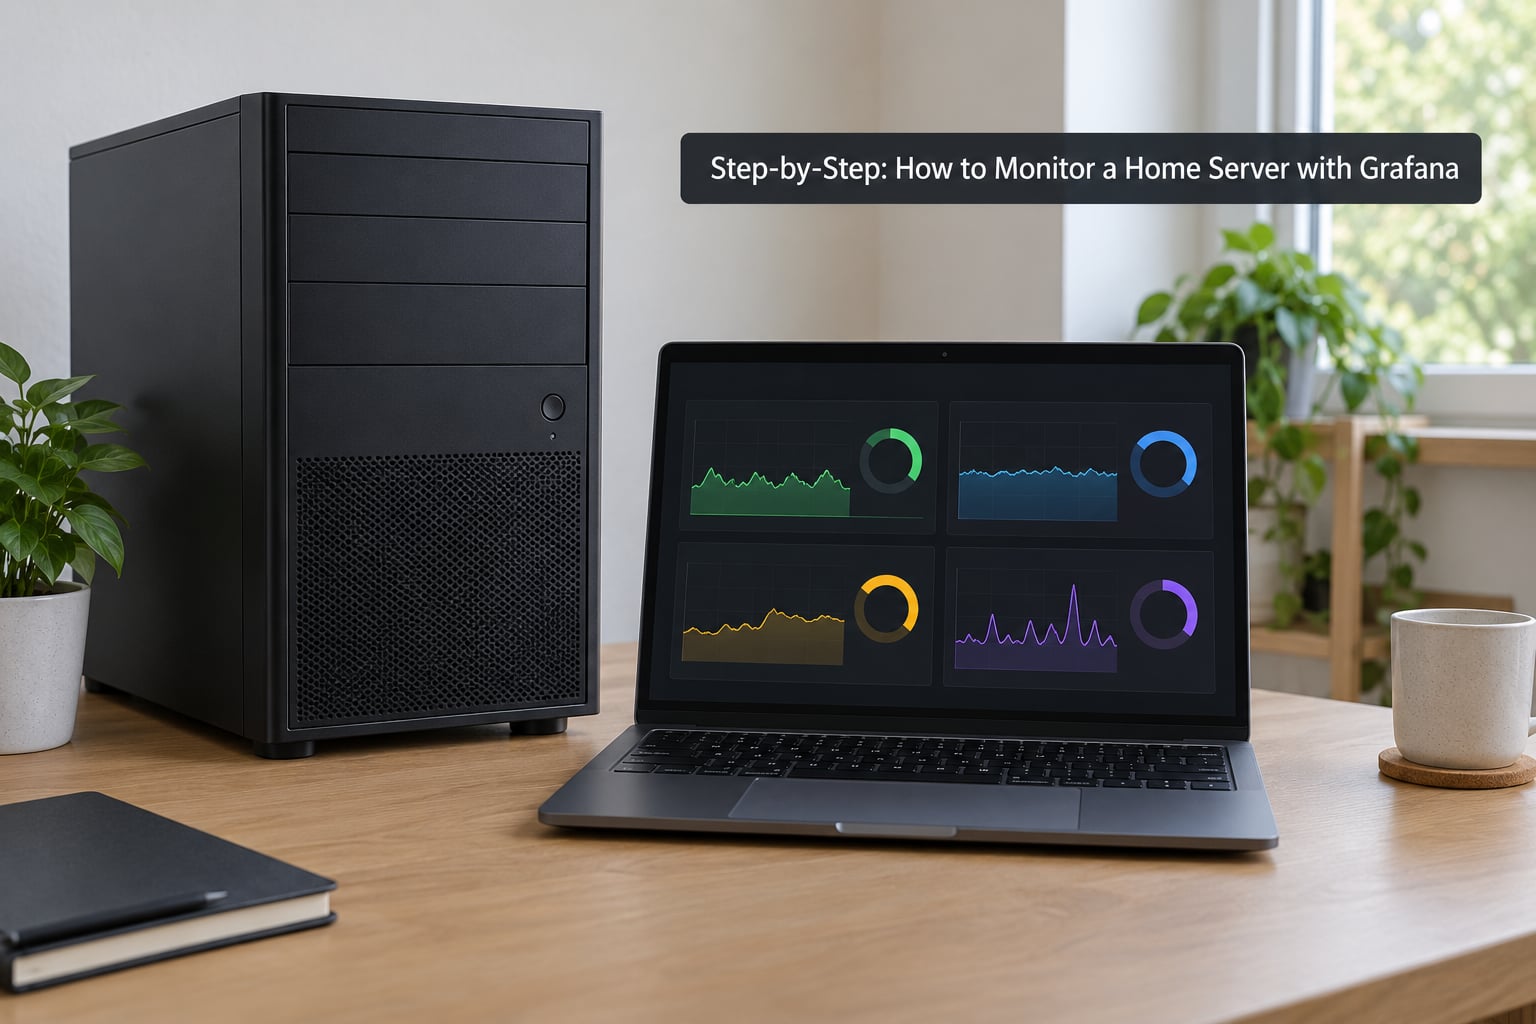
Install and configure the monitoring stack
Start with the machine that will hold the data. On Ubuntu and Debian, install Prometheus and Node Exporter from the distribution repositories, then add Grafana from its own apt repository:
sudo apt update && sudo apt install -y prometheus prometheus-node-exporter
sudo apt install -y apt-transport-https software-properties-common
wget -q -O - https://apt.grafana.com/gpg.key | sudo gpg --dearmor -o /usr/share/keyrings/grafana.gpg
sudo add-apt-repository "deb https://apt.grafana.com stable main"
sudo apt update && sudo apt install -y grafana
sudo systemctl enable --now prometheus prometheus-node-exporter grafana-server
On Fedora or RHEL the equivalents are dnf install prometheus node_exporter from EPEL plus the Grafana RPM, then systemctl enable --now prometheus node_exporter grafana-server.
If you would rather run the two central services in containers, this compose file is the whole stack. Replace the image tags with pinned versions once you know the pair works, since untagged tags change under you:
services:
  prometheus:
    image: prom/prometheus:latest
    container_name: prometheus
    network_mode: host
    volumes:
      - ./prometheus.yml:/etc/prometheus/prometheus.yml:ro
      - ./alert_rules.yml:/etc/prometheus/alert_rules.yml:ro
      - prometheus-data:/prometheus
    command:
      - '--config.file=/etc/prometheus/prometheus.yml'
      - '--storage.tsdb.path=/prometheus'
      - '--storage.tsdb.retention.time=30d'
      - '--storage.tsdb.retention.size=10GB'
    restart: unless-stopped
  node-exporter:
    image: prom/node-exporter:latest
    container_name: node-exporter
    network_mode: host
    pid: host
    volumes:
      - /:/host:ro,rslave
    command:
      - '--path.rootfs=/host'
    restart: unless-stopped
  grafana:
    image: grafana/grafana:latest
    container_name: grafana
    network_mode: host
    volumes:
      - grafana-data:/var/lib/grafana
    restart: unless-stopped

volumes:
  prometheus-data:
  grafana-data:
The ro,rslave mount and --path.rootfs=/host flag are what let the exporter report the host’s disks instead of the container’s overlay filesystem. Using privileged: true as a shortcut works too, but it hands the container far more access than it needs, and I would rather not make a habit of it.
Now write the scrape configuration. This is the file most guides skip formatting help for, so here is a complete version that works on first run:
global:
  scrape_interval: 30s
  evaluation_interval: 30s

rule_files:
  - /etc/prometheus/alert_rules.yml

scrape_configs:
  - job_name: prometheus
    static_configs:
      - targets: ['localhost:9090']

  - job_name: node
    static_configs:
      - targets: ['192.168.1.20:9100', '192.168.1.21:9100']
        labels:
          site: home

  - job_name: cadvisor
    static_configs:
      - targets: ['192.168.1.20:8080']
Give every host a job name you will recognise a year from now — job_name: node is fine for a first pass, but job_name: nas-proxmox or job_name: pi-cluster pays off the first time you have four servers and one of them is down. Check the file before restarting anything:
sudo promtool check config /etc/prometheus/prometheus.yml
sudo systemctl restart prometheus
On each machine you want to watch, install and start the exporter:
sudo apt install -y prometheus-node-exporter
sudo systemctl enable --now prometheus-node-exporter
Verify in two places. From the monitoring host, curl -s http://192.168.1.20:9100/metrics | head should print metric lines, and if it prints nothing the exporter is not listening or a firewall is in the way. Then open http://localhost:9090/targets and confirm every row reads UP. Anyone setting this up will tell you the targets page is the screen you will actually use while debugging.
Create a useful home-server dashboard
Add the data source first. In Grafana go to Connections, then Data sources, choose Prometheus, and set the URL to http://localhost:9090 when both run on the same machine, or http://prometheus:9090 when they share a Compose network. Press Save and test — a green confirmation here means the connection works, and a timeout means the URL is wrong.
Next, import a community dashboard rather than building panels from scratch. Go to Dashboards, New, Import, and enter 1860, the widely used Node Exporter Full dashboard.
Choose your Prometheus data source in the import dialog. This is the step that decides whether you get a dashboard or an afternoon of staring at empty panels: skip it, leave the variable unset, and every panel reads “No data”. If you have several data sources, tick the one that matches your Prometheus instance.
Some versions of 1860 also ask you to set a variable. Leave the built-in job and node values pointing at the job names in your prometheus.yml — that variable is what switches panels between your servers. After import, the templating dropdown at the top of the dashboard should list every host you scraped.
Build a small set of custom panels for the things you actually act on. These four PromQL queries cover most home servers:
- Disk free:
100 - (node_filesystem_avail_bytes{mountpoint="/"} / node_filesystem_size_bytes{mountpoint="/"} * 100)with unit set to percent. - Memory used:
(1 - node_memory_MemAvailable_bytes / node_memory_MemTotal_bytes) * 100, unit percent. - CPU busy:
100 - (avg by(instance) (rate(node_cpu_seconds_total{mode="idle"}[5m])) * 100). - Network throughput:
rate(node_network_receive_bytes_total[5m])and the transmit equivalent, unit set to bytes/sec.
On multi-disk or microSD hosts, dashboard 1860 often reports nonsense because it includes tmpfs and overlay mounts. Add a filter such as {instance="$instance",fstype!~"tmpfs|overlay|squashfs"} to the filesystem panels, or start the exporter with --collector.filesystem.mount-points-exclude=^/(dev|proc|sys|run|var/lib/docker/.+|snap/.+)($|/) as discussed in r/grafana.
A healthy reading on a quiet home server looks boring on purpose: CPU under 20 percent, memory between 40 and 70 percent used, root filesystem in the low tens of percent, and the uptime panel showing no gaps. Boring is the goal.
Add alerts for failures and resource pressure
Dashboards are only useful if you look at them. Alerts are what tell you about a disk filling at midnight while you are asleep. Start with three rules that map to the failures that actually happen on a home server:
groups:
  - name: home-server
    rules:
      - alert: HostDown
        expr: up == 0
        for: 5m
        labels:
          severity: critical
        annotations:
          summary: "{{ $labels.instance }} has not been scraped for 5 minutes"

      - alert: DiskFillingUp
        expr: (node_filesystem_avail_bytes / node_filesystem_size_bytes) * 100 < 15
        for: 30m
        labels:
          severity: warning
        annotations:
          summary: "Under 15 percent free on {{ $labels.mountpoint }} at {{ $labels.instance }}"

      - alert: MemoryPressure
        expr: (1 - node_memory_MemAvailable_bytes / node_memory_MemTotal_bytes) * 100 > 90
        for: 15m
        labels:
          severity: warning
        annotations:
          summary: "Memory above 90 percent on {{ $labels.instance }}"
Reload with curl -X POST http://localhost:9090/-/reload or restart the service, then check the Rules page in the Prometheus UI. The for clause is the anti-noise switch: without it, a single failed scrape or a 30-second backup job spikes an alert into your inbox every night.
To deliver them, add a contact point in Grafana under Alerting, Contact points — email, Slack and Discord all work from the same form. Fill in {{ .Labels.instance }} and {{ .Annotations.summary }} in the message so each alert tells you which machine it is about. For a server at the end of a VPN, a dead man’s switch beats host-based alerts: an always-firing alert that stops arriving is itself the signal something broke. The InfluxData community thread on server availability is where that pattern gets discussed in detail.
Test each rule before you trust it. Temporarily set a threshold to a value your machine is already at, confirm the alert arrives in the channel you expect, then put the real number back.
Secure and maintain the setup
The default install runs node_exporter as root, which is more access than it needs. Create a locked service account and hand the exporter to it:
sudo useradd --no-create-home --shell /usr/false node_exporter
sudo chown node_exporter:node_exporter /var/lib/prometheus/node_exporter
sudo systemctl edit prometheus-node-exporter
In the override drop [Service] and User=node_exporter, then reload systemd. Where you keep dashboards, directories and rules under /etc/grafana, check the ownership too, since Grafana runs as its own grafana user and will refuse to start without it.
Do not expose port 3000 or 9090 to the internet. Port-forwarding Grafana straight to a public address is one of the most common self-hosting mistakes, and the Prometheus UI has no authentication at all by default. Reach your dashboards over a VPN such as Tailscale or WireGuard, or put Grafana behind a reverse proxy with TLS and an auth layer. The community advice from r/selfhosted and lobste.rs threads converges on exactly this: private network access, or a proxy that handles authentication for you.
Retention is the other thing that will bite you. Prometheus is not long-term storage — it is a local time-series database that fills a disk like anything else. With a 30 second interval, a single node_exporter target writes on the order of a megabyte or two per day, so three hosts plus cAdvisor lands somewhere around 5–15 GB per month depending on how many series each exporter produces. Set both limits and let Prometheus trim itself:
--storage.tsdb.retention.time=30d
--storage.tsdb.retention.size=10GB
Mount the Prometheus data directory on a real volume, not inside the container’s writable layer, or you will lose everything on recreate — the exact complaint box464 hit with a Portainer stack. A monthly routine of three things keeps this healthy: run docker compose pull and restart one service at a time rather than recreating the whole stack, confirm all targets are still UP on the targets page, and confirm Grafana still answers. Keeping the YAML and dashboard JSON in git alongside your other server configs makes the rebuild after a disk failure a five-minute job.
Common Mistakes
Grafana shows “No data” after importing dashboard 1860. You skipped the data source selection in the import dialog, or the templating variable points at a job name that does not exist in your prometheus.yml. Re-import and pick your Prometheus data source, then open the targets page and confirm every host reads UP.
Prometheus targets all read DOWN. Usually the exporter is not running or a firewall blocks port 9100. Check with systemctl status prometheus-node-exporter on the target machine, then curl -v http://HOST:9100/metrics from the monitoring host. A wrong subnet or a host address that changed is the other common cause.
Prometheus will not restart after a config edit. Run promtool check config /etc/prometheus/prometheus.yml and read the error. A tab where YAML expects spaces, or a missing quote around an address, is nearly always the problem.
Disk metrics look wrong or show a tiny root filesystem. That is the container’s overlay, not your host. Add the ro,rslave root mount plus --path.rootfs=/host, and exclude tmpfs and squashfs mounts from the dashboard panels.
Panels are empty for CPU or network. The scrape interval may be shorter than your dashboard’s minimum step, or the query uses a rate window shorter than the interval. Keep rate(...[5m]) and match your panel step to the scrape interval.
Graphs show the wrong time or empty blocks after midnight. That is a timezone mismatch between the host and the browser. Pin the dashboard timezone to browser time or UTC so the series do not shift underneath you.
Alerts never fire. Check the Rules page and the alert state — pending means the for duration has not elapsed yet. If a rule looks right and never triggers, open the expression in the expression browser and run it against a wider time range to see whether the metric exists at all.
Everything vanished after a container restart. The data was never on a volume. Bind-mount or name a volume for /prometheus and /var/lib/grafana before you care about history.
Memory climbing on the monitoring host. Long retention plus many targets is the usual cause, and adding hosts multiplies it. Trim retention first; add a dedicated scrape job for noisy exporters such as cAdvisor on a longer interval if you still need headroom.
Frequently Asked Questions
Can I monitor multiple home servers with one Grafana instance?
Yes, and that is the normal way to run it. Install node_exporter on every machine, then add each address under static_configs in the same scrape_configs job, or give each server its own job_name. Grafana’s dashboard variables switch panels between hosts, so one dashboard can cover the whole lab. Keep scrape_interval at 30 seconds for a handful of machines and raise it if the Prometheus host struggles.
Can a Raspberry Pi run Grafana and Prometheus for a home lab?
A Pi 4 handles a small lab comfortably. Budget roughly 200-400 MB of RAM for Grafana and 300 MB to 1 GB for Prometheus depending on how many targets you scrape. Use a 15 or 30 second scrape interval rather than 5 seconds, keep retention to a few weeks, and put the Prometheus data directory on an SSD, since SD cards wear out under constant writes.
Do I need cAdvisor to monitor Docker containers?
Node Exporter reports the host’s total CPU, memory and disk, so it will never show which container caused the spike. cAdvisor adds per-container CPU, memory and filesystem usage on port 8080 and is scraped like any other exporter. Add it as its own job in prometheus.yml, then import a cAdvisor dashboard. Skip it entirely if your containers run as LXC guests, since Proxmox reports those separately.
How do I get alerts when a service goes down at home?
Add a contact point under Alerting, Contact points in Grafana, choosing email, Slack or Discord, then reference the alert labels in the message template. A HostDown rule with a five minute for: clause catches dead hosts. For services that fail while the host stays up, add a blackbox exporter probe against the service URL so Prometheus can tell a crashed app apart from a crashed machine.
How do I tell a host failure apart from an application failure?
A host down alert fires from up == 0, meaning Prometheus cannot reach the exporter at all, which points at power, network or a stopped node_exporter service. An application failure leaves the host perfectly scrapeable, so you need a second signal: a blackbox exporter probe against the service endpoint, or a Grafana-managed alert that watches a metric the application exposes. Comparing the up panel with the service panel usually settles it in seconds.
Start with the smallest version that works: node_exporter on one machine, a Prometheus scrape job for it, and dashboard 1860 in Grafana. Once that panel is green, add the second host, then the alert rules, and only then the hardening and retention settings. Watching a boring, flat dashboard on your own hardware beats any hosted dashboard you do not control.