Windows Event Viewer is the built-in console that shows event logs, which are structured records of what Windows, your drivers, your services, and your applications did and when. Learning how to read Windows Event Viewer logs takes about ten minutes of practice once you know which pane to click, and it is the fastest way to find the real cause of a crash, an unexpected shutdown, or a service that refuses to start instead of guessing. This guide works on Windows 10 and Windows 11, and the same habits carry over to Windows Server.
The mistake almost everyone makes is scrolling a list of a few thousand red entries and hoping something jumps out. The better method is a fixed routine: open the right log, filter to the ten minutes when the problem happened, then read the events around that timestamp as a story. That is what I do first on any machine that misbehaves, and it works whether you are a home user or a sysadmin covering forty servers.
Table of Contents
- What You Need
- How to Read Windows Event Viewer Logs Step by Step
- Open Event Viewer and Choose the Right Log
- Filter Noise and Find the Relevant Events
- Read the Event Details and Follow the Story
- Export or Save the Evidence
- Common Mistakes
- Frequently Asked Questions
- What does Event ID 41 mean in Windows 11?
- What does Event 6008 mean?
- Where are Windows Event Viewer log files located?
- Should I clear my Windows Event Viewer logs?
- Is it normal to see errors in Event Viewer on a healthy PC?
- Conclusion
What You Need
Nothing to buy and nothing to install. Event Viewer ships with every Windows 10 and Windows 11 release, and the console is reachable in three clicks from the Run dialog.
Administrator access matters more than most guides admit. The System and Application logs open fine as a standard user, but Security, Forwarded Events, and the ability to clear or export some channels are gated behind elevation. If a log is greyed out or the filter pane throws an error, that is usually the reason.
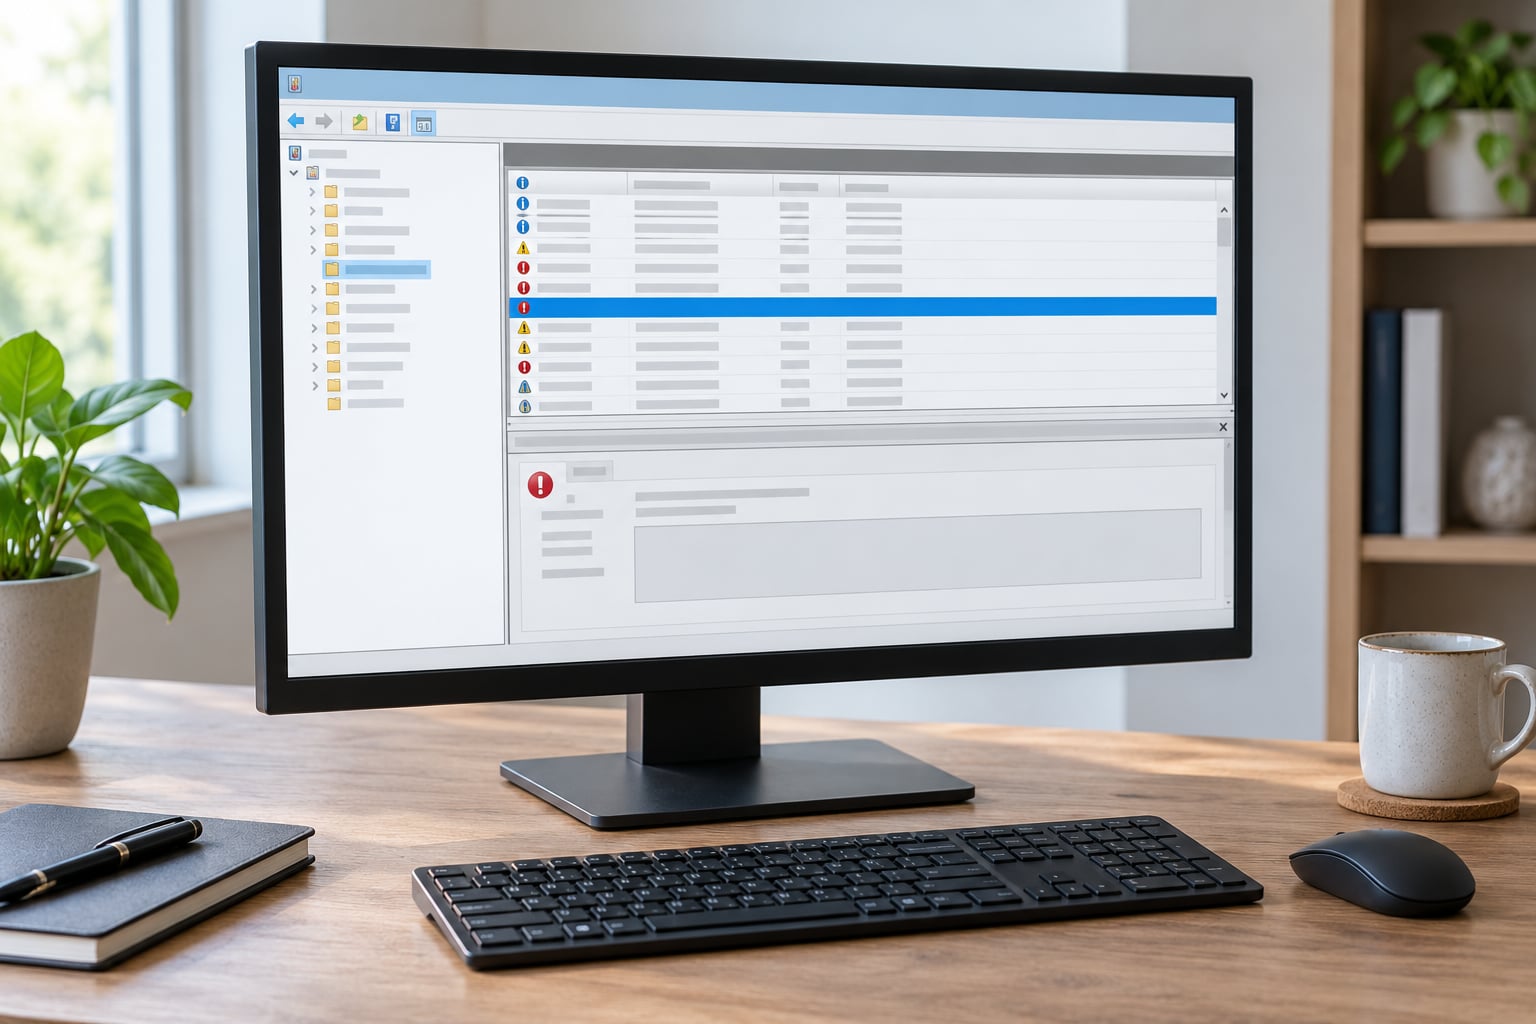
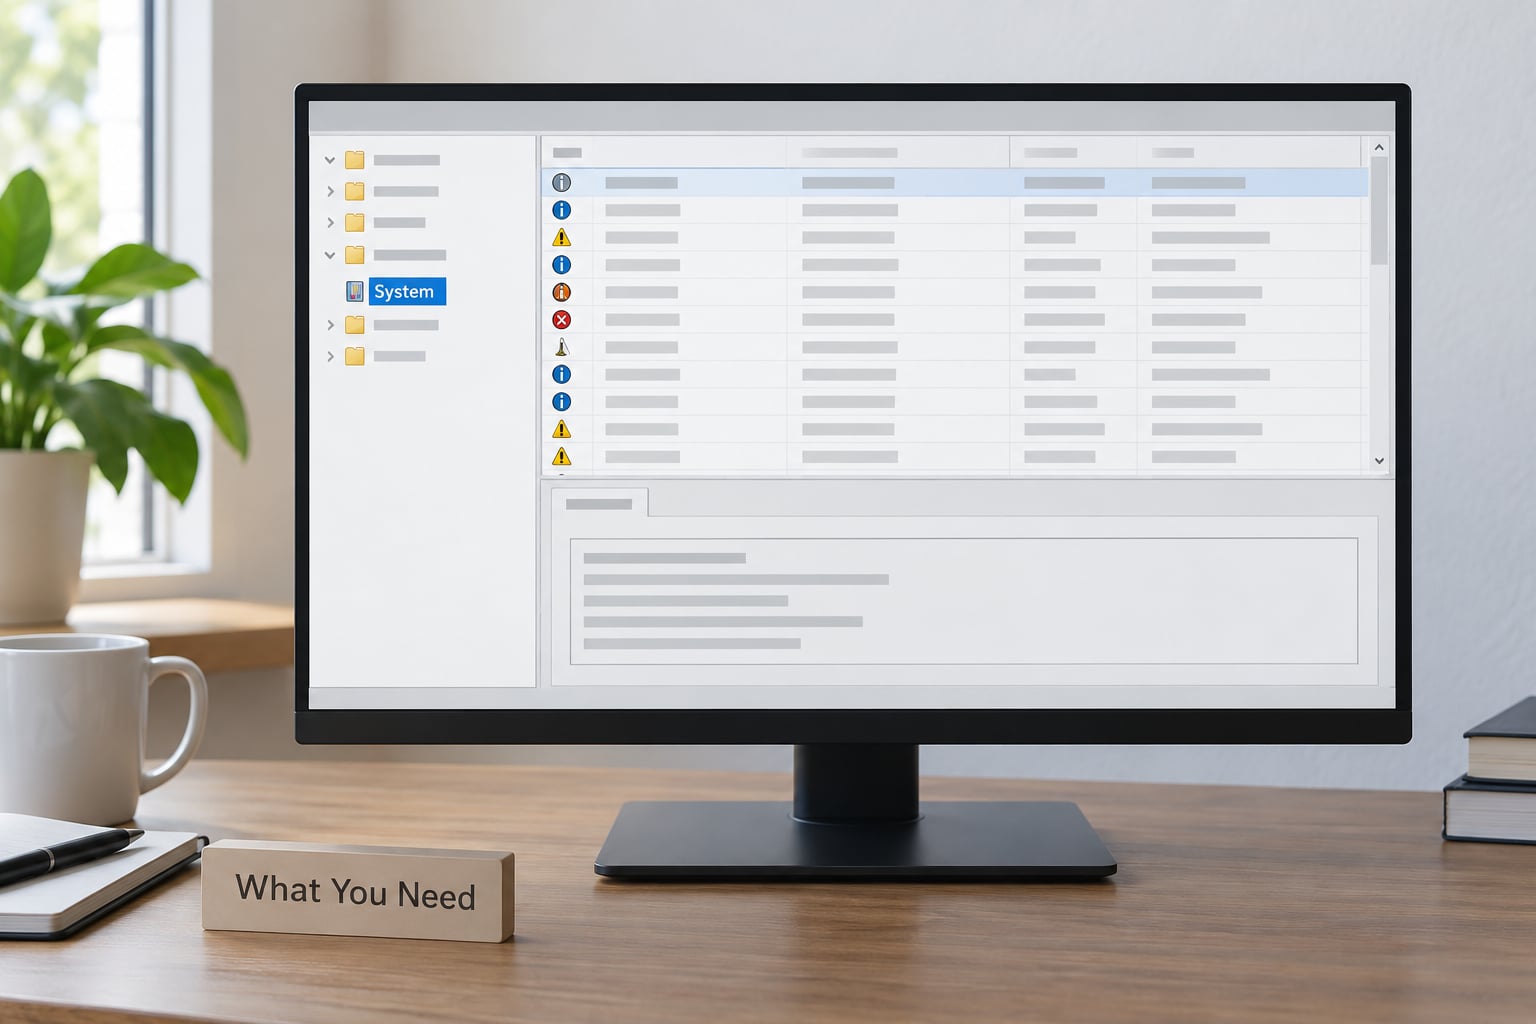
Worth knowing about the layout before you start. Event Viewer uses three panes: a navigation tree of all logs on the first, the event list in the centre, and a detail area at the bottom that shows the General tab for whichever event you selected. Once you internalise that, nothing else feels strange.
Two things differ slightly by version. On Windows 10, Event Viewer sits in the Control Panel folder under Administrative Tools. On Windows 11 it moved into Windows Tools, which you reach from the Start menu or by running control /name Microsoft.WindowsTools. Older server releases and Windows 7 label some locations differently, but the core workflow is identical.
On disk, the log files live in %SystemRoot%System32WinevtLogs as .evtx files. You do not need to go there for normal troubleshooting, but knowing the path explains the file sizes you will see in the Properties dialog and helps when you need to pull a log off a machine that will not boot far enough to show you the console.
How to Read Windows Event Viewer Logs Step by Step
Open Event Viewer and Choose the Right Log
Press Win+R, type eventvwr.msc, and press Enter. If the console opens with Windows Logs expanded, you are in. That single command works identically on Windows 10, Windows 11, and Server editions, which is why it beats hunting through Start menus when you are on a deadline.
Two alternatives are worth memorising. From the Start menu, search for Event Viewer on Windows 10, or search for Event Viewer and pick the Windows Tools entry on Windows 11. From an administrative command prompt, eventvwr.msc runs directly, and so does eventvwr /? if you want the switches.
Choosing the log is the decision that matters more than anything else in this whole guide.
| Log | What it records | Look here when |
|---|---|---|
| System | Hardware, drivers, the operating system kernel, services, and the Event Log service itself | The machine crashes, shuts down, loses a disk, or a driver misbehaves |
| Application | Installed programs, libraries, and application crashes, with the faulting module named | One specific app dies, hangs, or refuses to install |
| Security | Logons, logoffs, account and group changes, audit policy activity | You suspect unauthorised access or need a login audit trail |
| Setup | Operating system installation, upgrade, and feature deployment | An update failed, or you are tracking a migration |
| Forwarded Events | Events collected from other machines by a Windows Event Forwarding subscription | You monitor several machines at once |
One Security log caveat. The channel is only populated when audit policy is switched on, and the Local Security Policy settings that control it live under Computer ConfigurationWindows SettingsSecurity SettingsLocal PoliciesAudit Policy. Out of the box you will see plenty of 4624 successful logons and little else, because most advanced audit subcategories default to No Auditing. If you are hunting failed logons, 4625 events show up by default; if you want account creation tracked you generally have to enable that subcategory yourself.
A word on perspective before you go further. A healthy Windows 11 laptop routinely shows dozens of Error entries in System over a few days. Disk timeouts, a flaky USB device, a network adapter resetting, a third-party shell extension. Seeing a wall of red is normal and is not evidence that anything is seriously broken.
Filter Noise and Find the Relevant Events
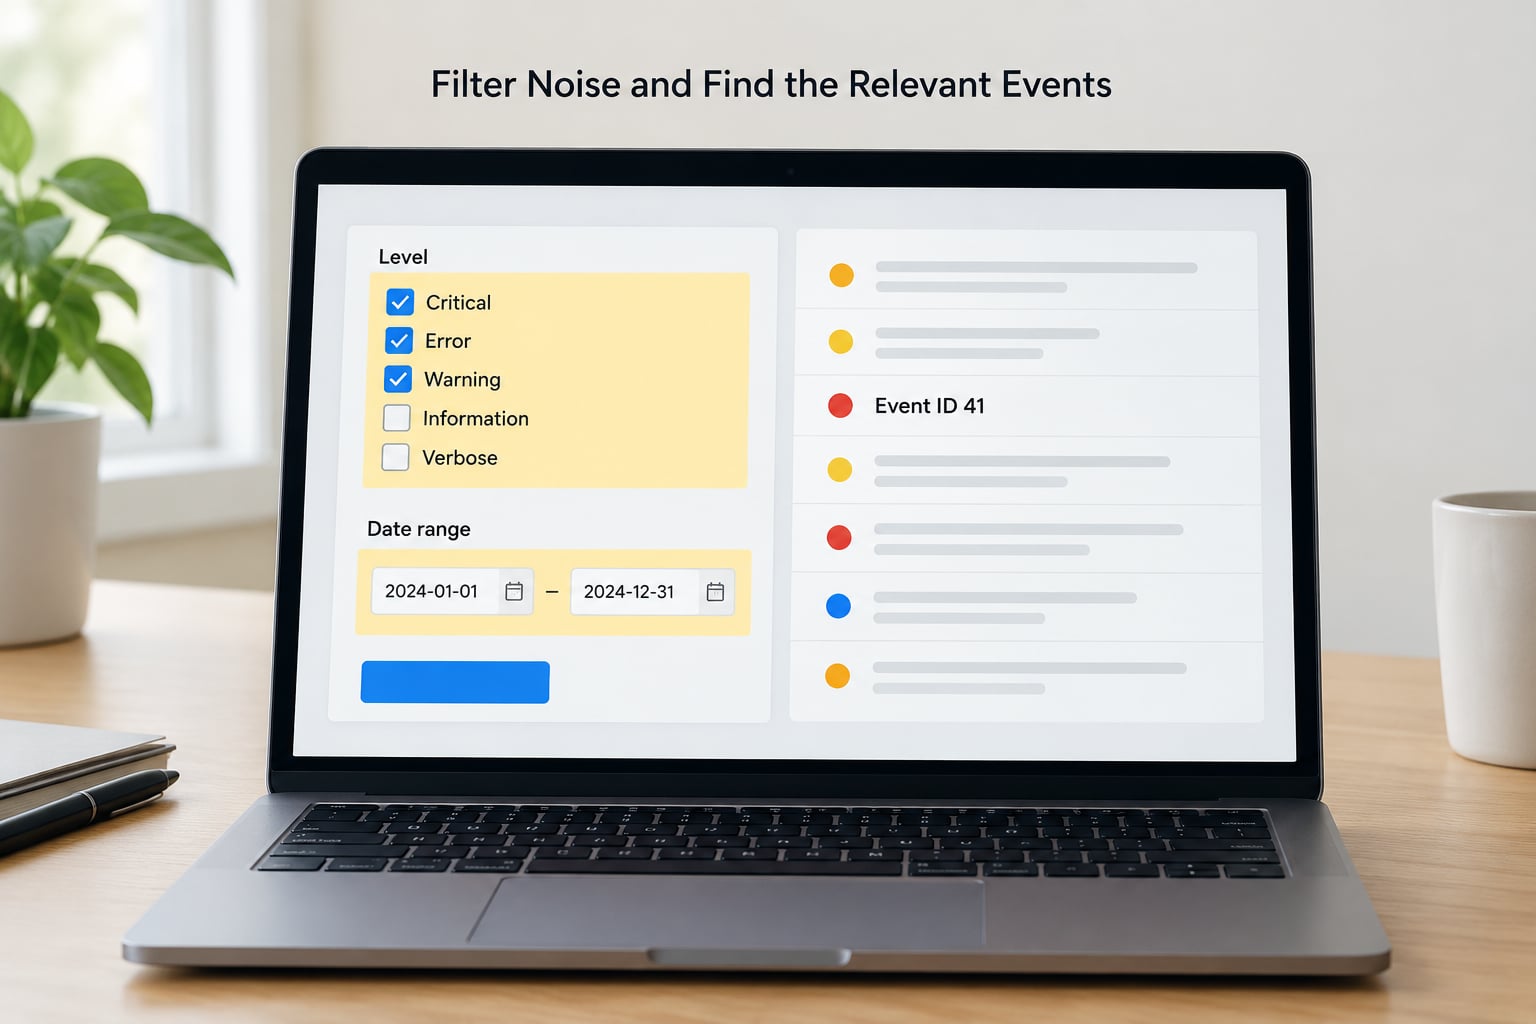
Right-click the log in the navigation pane and choose Filter Current Log. Work in this order, because each step narrows the next one:
1. Set the time window first. Pick Last 24 hours, Last 7 days, or Custom range and type the exact times around the failure. Starting with level filters before a time window is backwards, and it is why people conclude there is nothing to find.
2. Add Levels. Tick Critical, Error, and Warning. Leave Information unchecked unless you are chasing a specific service start, because informational events dominate the list.
3. Add the Source. This is the field people underuse. Filter to disk, stornvme, storahci, or Ntfs for storage problems, Service Control Manager for services that failed to start, Microsoft-Windows-WER-SystemErrorReporting for blue screen post-mortems, and Microsoft-Windows-Kernel-Power for shutdowns. Filtering by provider beats scanning for a specific Event ID when you do not yet know which one to look for.
4. Add Event IDs when you know them. Typing 41,6008,1001 in the Event IDs box is valid and takes you straight to the shutdown chain.
5. Select Apply filter to sublogs if you were at the Windows Logs node rather than a specific channel, then press OK.
How do you know the filter worked? The count in the centre pane drops from thousands to a handful, and the entries you care about cluster in one time block rather than spreading evenly across weeks.
Two habits that speed this up a lot. Right-click a column header to sort by Date and Time or by Source instead of scrolling, and use View > Filtered Custom View to keep a filter alive across sessions. A custom view called Shutdown Diagnostics that is permanently set to Kernel-Power plus Event IDs 41, 1001, 6008, and 1074 turns a ten-minute hunt into a five-second one.
Read the Event Details and Follow the Story
Click an event. The General tab at the bottom gives you Date and Time, Log, Source, Event ID, Level, Task Category, and the user and computer the event came from. That header block is the index to the log, and for most problems you can stop there and search the Event ID online.
The message body below it depends on the provider. A Service Control Manager 7000 event tells you exactly which service failed to start and gives you the error code it returned. A disk 51 event names the device and the paging file. A BugCheck 1001 event gives you the stop code in the first line, which you can look up on Microsoft Learn.
Switch to the Details tab when the General tab flattens the useful parts. It shows the same data as raw XML, and for some providers it adds a View XML button. The <Data Name="..."> elements are insertion strings, and they carry the real payload: file paths, module names, service names, parameter values. This is the single most useful thing to learn, because it is the difference between reading a sentence and reading the data behind it.
One gotcha catches everyone. Events are timestamped in UTC internally and rendered in your local time, and on a machine that is drifting, the clock may be wrong entirely. When the timestamps make no sense, check the clock before you start trusting the sequence.
Then read the neighbours. One isolated error is a data point; five events in a ninety-second window are a story.
Here is the chain most people meet first. Your PC switched itself off and came back with no warning.
1. Open System, filter to the time window around the restart, and add Level Error and Critical. Look for Event ID 41 from Microsoft-Windows-Kernel-Power. This is the symptom, not the cause. Windows only wrote it because the system came up without a clean shutdown.
2. Just after it, find Event ID 6008 from the EventLog source. That one confirms the previous shutdown was unexpected and gives you the exact time the system last stopped responding.
3. Look for Event ID 1001 from Microsoft-Windows-WER-SystemErrorReporting, logged at the same boot. If it exists, the machine blue-screened or bugchecked, and that event carries the bugcheck code. This is your root cause.
4. If 1001 is absent, the machine lost power, reset, or was hard-cycled. Check for Event ID 1074 from the User32 source, which records a clean shutdown or restart with the process and reason that requested it. If a user or a scheduled task is named there, the shutdown was intentional. If nothing shows, suspect the power supply, the PSU cable, overheating, or a faulty drive.
5. Read any disk or stornvme warnings from a few minutes before the shutdown. A drive that drops off the bus produces exactly this signature, and it is fixable while the drive is still readable.
The 41 plus 6008 pair is the most recognised PC-shut-itself-off signature there is. What matters is that 41 tells you nothing on its own, and people who stop there spend a week blaming power supplies when the answer was sitting in event 1001 the whole time.
Export or Save the Evidence
Save evidence before you change anything, because most fixes involve a reboot and some of them wipe the log you need.
To save one event, right-click it in the list and choose Copy, or use Actions > Export View to get the full text of the filtered selection. To save a whole view, right-click the log and pick Save As for a single channel, or Save Filtered Log File to keep only what your filter matched. Choose XML or EVTX when a colleague, Microsoft support, or a log analysis tool will read it later; choose CSV when you intend to open it in Excel and sort it yourself.
Verify the export before you rely on it. Open the saved file and confirm it carries the timestamp, source, Event ID, level, and the full message. A truncated export that is missing the message body is the one that wastes an afternoon.
PowerShell covers the scripted cases, and Get-WinEvent is much faster than clicking when you know what you want.
Filter the last day of critical and error system events:
Get-WinEvent -FilterHashtable @{LogName='System'; Level=1,2; StartTime=(Get-Date).AddDays(-1)} | Select-Object TimeCreated, Id, ProviderName, MessagePull one Event ID and export it:
Get-WinEvent -FilterHashtable @{LogName='System'; Id=41} -MaxEvents 20 | Export-Csv -NoTypeInformation -Path .kernel41.csvSave a full channel as XML with the command-line tool:
wevtutil epl System C:logssystem.evtxLog size and retention are set per channel. Right-click a log, open Properties, and you will see the configured maximum size, the file’s current size, and mode: Overwrite events as needed, Archive the log when full, or Do not overwrite events. Overwrite is the default everywhere and it means old entries quietly vanish once a log fills. If you are investigating something that happened last month, check the size first, because the evidence may have rolled off.
What you should never do is clear a log to “start fresh” while investigating. The moment you clear, Windows writes its own marker: Event ID 104 in the System log, and 1102 in the Security log, both recording that someone cleared the audit log. That pair is a permanent note in the history of a machine, and it turns a clean investigation into a question about why the evidence disappeared.
Common Mistakes
Treating a warning as the root cause. A Warning is context, not a verdict. Disk warnings and NTFS entries often appear hours before a failure they did not cause. Fix the pattern, not the loudest entry.
Reading the wrong log. An app crash lives in Application, not System. If the tree is greyed out for Security, you probably need an elevated prompt. Check the log name in the event header before you start interpreting anything.
Ignoring timestamps and time zones. Events are stored in UTC and displayed locally. If the times look impossible, the machine clock drifted, and no amount of correlation will help until you fix that.
Assuming every error is malware. Event Viewer records a lot of ordinary failures, including failures by your own antivirus. Look for a cluster across several providers before you reach for dramatic conclusions.
Forgetting to refresh. The console does not always repaint live data. Right-click a log and choose Refresh, or reopen the console, before you conclude an event is missing.
Reading one event and stopping. Correlate. The cause is almost always a few rows above or below the entry that got your attention.
Clearing logs before preserving evidence. Export first, then experiment. If you must clear, the 104 and 1102 entries stay behind as a record that you did.
Looking in the wrong place for app problems. When a specific program misbehaves but the Application log looks clean, open Reliability Monitor by running perfmon /rel. It shows crashes, hangs, and Windows Update failures in a plain timeline, and it is the tool Windows itself points you at for app problems.
For anything beyond a single machine, the GUI stops scaling quickly and sysadmins generally collect events into a SIEM or Log Analytics instead. On one box, Event Viewer plus Get-WinEvent is more than enough.
Frequently Asked Questions
What does Event ID 41 mean in Windows 11?
Event ID 41, logged by Microsoft-Windows-Kernel-Power in the System log, means Windows restarted without a clean shutdown. It is a symptom, not a cause: the machine lost power, hung, was hard-cycled, or bugchecked. Check for a BugCheck 1001 entry at the same boot, because that carries the actual stop code. If no 1001 event exists, look at Event 1074 for a requested restart, then suspect power, heat, or a failing drive.
What does Event 6008 mean?
Event ID 6008, written by the EventLog source in the System log, records the unexpected shutdown of Windows and the last time the system was running. It appears on the next boot, right after Kernel-Power 41. Together they confirm an unclean shutdown rather than a restart you requested. Because it logs local time, use it to anchor the exact time window, then read the events immediately before that moment for the real cause.
Where are Windows Event Viewer log files located?
The log files live in %SystemRoot%u005cSystem32u005cWinevtu005cLogs as .evtx files, one per channel, including System.evtx, Application.evtx, and Security.evtx. You rarely need to open them directly, but the path matters when a machine will not boot into the desktop, when you are copying logs off a failing PC, or when you are checking whether a log has already rolled over and dropped the events you need.
Should I clear my Windows Event Viewer logs?
Not while you are troubleshooting, because clearing removes the evidence you came for. Windows records the deletion itself: Event ID 104 in the System log and Event ID 1102 in the Security log, both stating the log was cleared and by which account. That marker stays in the history of the machine, which raises questions with whoever owns it. Export the log to XML or CSV first, clear only if you have a good reason, and note that clearing changes nothing about the underlying fault.
Is it normal to see errors in Event Viewer on a healthy PC?
Yes. A healthy Windows 10 or 11 machine accumulates plenty of Error and Warning entries over a few days: disk timeouts, network adapter resets, failed driver updates, and crashes from programs you closed from the taskbar. A sudden spike in one provider matters far more than a steady background noise. Judge volume by change over time for a single source, and by correlation across several sources at one timestamp, not by how much red the list shows.
Conclusion
Start with the symptom, not the log. Note the time it happened, open the log that matches it, filter to that window, and read the events immediately before and after the one that alarmed you. Export what you find before you change anything, since most fixes reboot the machine and some of them empty the evidence.
That method beats searching event IDs on a forum every time, and it gets easier. A few saved custom views and a couple of Get-WinEvent snippets will cover most of what you will ever need, whether you are fixing your own laptop or someone else’s.