SMART data is the health telemetry a drive reports about itself, and knowing how to read SMART data and understand it takes one command or one utility. On Linux you run smartctl against a device path, on Windows you install CrystalDiskInfo or query the physical disk stack with PowerShell, and the output gives you counters for reallocated sectors, pending sectors, wear, temperature and power-on hours. Interpreting those counters is the harder half of the job, because the normalized health percentage most tools display is close to meaningless on modern drives.
This guide is written for developers, sysadmins and technical hobbyists. It covers where the numbers come from, how to pull them on each platform, which columns to actually trust, and how to turn a snapshot into a trend you can act on. As of 2026, the tooling has not changed much, but the failure modes have, and most of the confusion on this topic comes from mixing up vendor-specific raw values with standardized normalized ones.
Table of Contents
- What SMART Data Is—and What It Can Tell You
- What You Need Before Reading SMART Data
- How to Read SMART Data on Linux
- How to Interpret Linux SMART Output
- How to Read SMART Data on Windows
- What to Understand in Common SMART Attributes
- Why SMART Values Must Be Compared Over Time
- What to Do When SMART Reports a Warning
- What SMART Data Cannot Tell You
- Frequently Asked Questions
- What is the difference between raw and normalized SMART values?
- How many reallocated sectors is too many?
- Does a SMART PASSED result guarantee the drive is healthy?
- Why can’t I read SMART data from my external hard drive?
- What does NVMe Percentage Used mean when it reaches 100?
- How many power-on hours is too many for a hard drive?
- Conclusion
What SMART Data Is—and What It Can Tell You
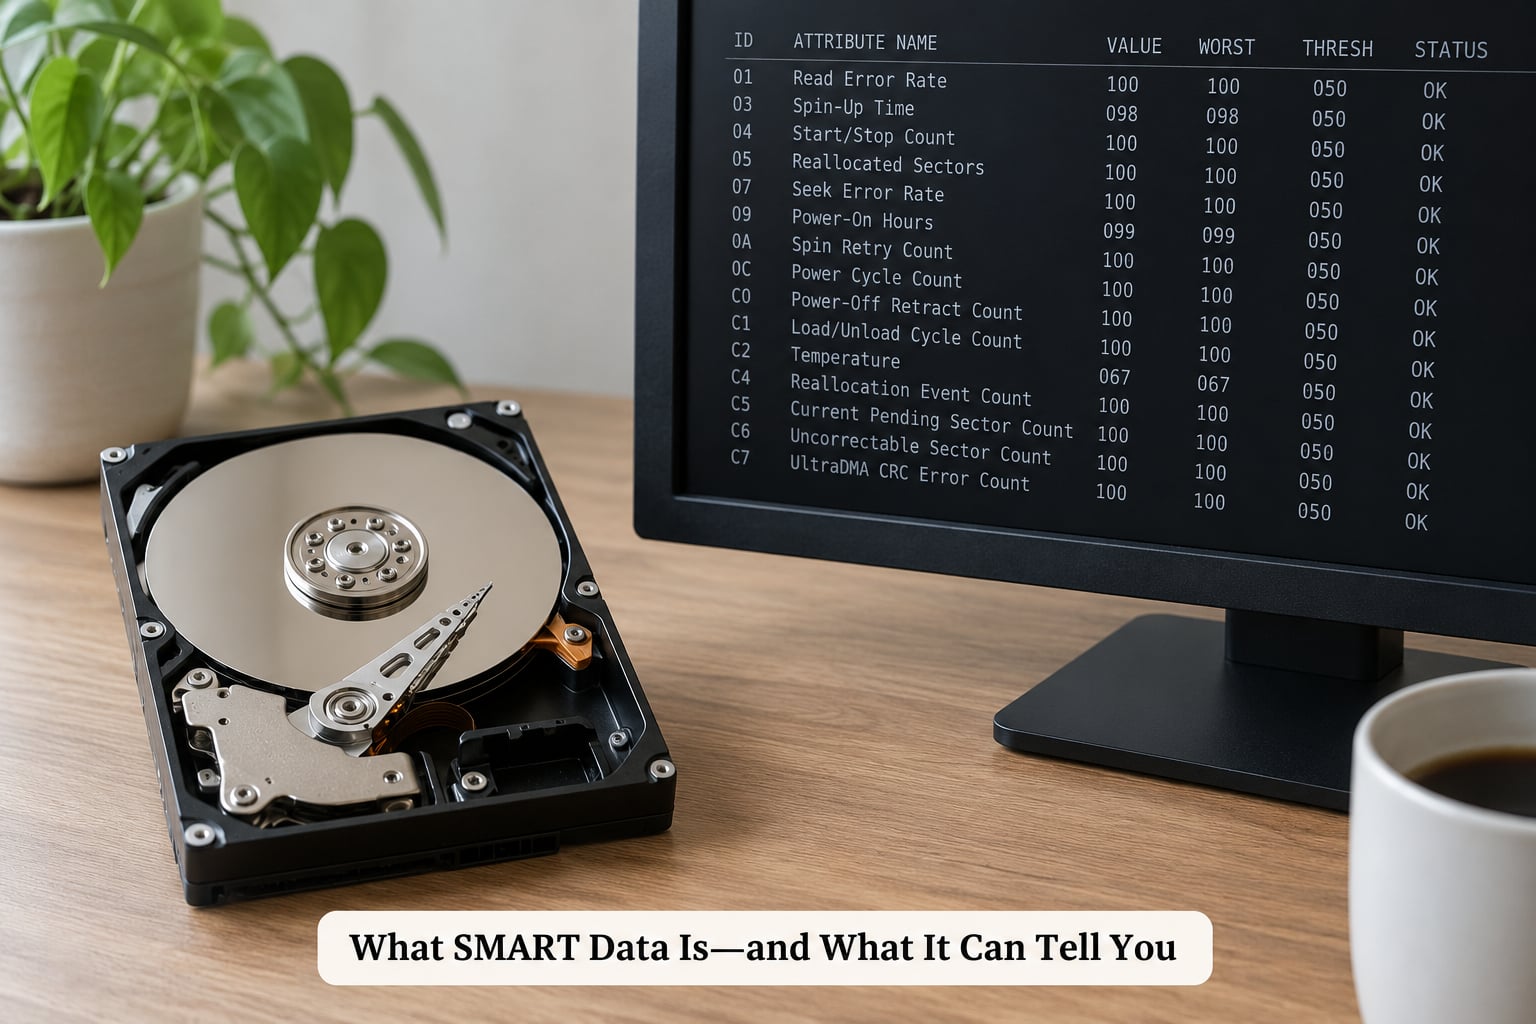
S.M.A.R.T. stands for Self-Monitoring, Analysis and Reporting Technology. It is a standard command set that lets a host read a log the drive maintains about its own operating condition. Every ATA hard drive and SSD reports into that log continuously while it is powered, and NVMe devices expose the equivalent through a health information log page.
The acronym is a good hint that most people read backwards. The drive is not analyzing anything and it is not reporting a diagnosis. It is handing you a set of raw counters and leaving the interpretation to you, which is precisely why two people can look at the same output and reach opposite conclusions.
Four distinct kinds of information show up in what tools print:
- Raw values are the counters as stored by the drive: the literal number of sectors reallocated, the literal hours of power-on time, the literal temperature.
- Normalized values run from 1 to 254 and represent a vendor-defined fraction of expected life remaining. This is the column most GUIs lead with, and it is the one that causes the most confusion.
- Thresholds are the pre-failure limits a vendor set for each attribute. Crossing one flips the FAILING flag for that row.
- Logs and self-test results are separate structures holding the error log and the results of the drive’s own internal read sweep.
What SMART data can genuinely tell you is that a specific mechanism is showing wear or has already recorded recoverable read errors. What it cannot tell you is how much calendar time you have left, whether the failure will be gradual or sudden, or what caused the wear in the first place.
What You Need Before Reading SMART Data
Before you run anything, get five things straight. Skipping this is how people end up comparing a fresh laptop SSD against an eight-year-old desktop HDD and panic about the wrong number.
- Permission. Reading SMART sends low-level ATA commands, so you need root on Linux (via
sudo) and Administrator on Windows. A member of thediskgroup is enough on most distributions. - The exact device path. Disks are not always
/dev/sda. SATA disks often enumerate as/dev/sda, NVMe as/dev/nvme0or/dev/nvme0n1, and USB enclosures often show up as/dev/sdbat one boot and/dev/sdcthe next.lsblkandsudo smartctl --scansettle it. - The model, firmware and serial number. Run
sudo smartctl -i /dev/sda. You need this to look up what the vendor says each raw counter means, and to confirm the drive you think you are reading is the drive you are reading. - A baseline. Save today’s full output to a file. Comparing a reading against an eight-month-old capture is worth more than any universal threshold.
- Current backups. Reading attributes is harmless, but deciding to ignore a counter is only reasonable when your data already lives somewhere else.
One warning matters more than the rest: SMART data is drive-specific. An attribute ID means roughly the same thing across SATA drives of the same generation, but firmware revisions and SSD controllers redefine raw values freely. Two identical model numbers can report the same counter with different meanings. Treat any table you find online, including this one, as a starting point for judgment rather than a rule engine.
How to Read SMART Data on Linux
On Ubuntu and Debian, install smartmontools once and everything else follows from it. The package name has not changed in years, and the version on a current distribution is more than capable for both SATA and NVMe devices.
sudo apt update && sudo apt install smartmontoolsIdentify the devices first, so you know which path maps to which physical disk:
sudo smartctl --scan
/dev/sda -d scsi # /dev/sda, SCSI device
/dev/nvme0 -d nvme # /dev/nvme0, NVMe device
Then take the full report for the drive you care about. The -a flag is what you want in nearly every case:
sudo smartctl -a /dev/sdaThe rest of the useful commands map to specific questions. Drive identity comes from -i, and a quick pass or fail verdict from -H:
sudo smartctl -i /dev/sda
sudo smartctl -H /dev/sda
Attributes alone come from -A. If you only want the attribute table and nothing else, this is the cleanest way to get it:
sudo smartctl -A /dev/sdaFor NVMe you must tell smartctl which device type it is looking at, because the tool guesses wrong often enough to be annoying:
sudo smartctl -a /dev/nvme0 -d nvmeSelf-tests read the whole surface and report back. The short test runs while the drive is otherwise idle and takes a couple of minutes on most drives. The extended test can run for hours, and you can keep working while it goes if you start it in the background mode:
sudo smartctl -t short /dev/sda
sudo smartctl -t long /dev/sda
sudo smartctl -t long /dev/sda -w /tmp/sda-long-test.out
Results are stored in the device’s own self-test log, so you can read them days later:
sudo smartctl -l selftest /dev/sda
sudo smartctl -l selftest /dev/nvme0 -d nvme
The error log shows the ATA error register contents recorded during previous commands, which is useful context when a counter has started climbing:
sudo smartctl -l error /dev/sdaFor a quick health summary on an NVMe drive specifically, -H reports the composite percentage used and spare threshold:
sudo smartctl -H /dev/nvme0 -d nvmeHow to Interpret Linux SMART Output
The attribute block is the part everyone finds confusing, and most of the confusion is about which columns carry information. Here is a real block from a SATA SSD, annotated:
ID# ATTRIBUTE_NAME          FLAG     VALUE WORST THRESH TYPE      UPDATED  WHEN_FAILED RAW_VALUE
  5 Reallocated_Sector_Ct   0x0033   100   100   010    Pre-fail  Always       -       0
  9 Power_On_Hours          0x0032   099   098   000    Old_age   Always       -       8231
177 Wear_Leveling_Count      0x0013   094   094   000    Pre-fail  Always       -       22
190 Airflow_Temperature_Cel 0x0032   067   055   045    Old_age   Always   -       33
The ID is the attribute number, and it is the only column that is standardized. ID 5, 9, 190 and 197 mean the same thing across essentially all ATA drives.
FLAG is a bitfield. The part you care about is whether the attribute is marked Pre-fail or Old_age. Pre-fail attributes relate to imminent predicted failure. Old-age attributes describe the drive’s life in general, and crossing a threshold on an Old_age row is normal aging rather than a warning.
VALUE is the normalized health figure, scaled 1 to 254, where the vendor’s threshold sits at 100 by default. WORST is the lowest normalized value ever recorded. Both are computed by the vendor’s own formula, and on SSDs those formulas are frequently a simple restatement of temperature or wear with no real diagnostic content. Ignore them when deciding whether a drive is failing.
THRESH is the pre-failure limit. If the VALUE column ever drops to or below it, smartctl prepends a FAILING_NOW or In_the_Past marker to the row name. That marker matters. The VALUE column on its own does not.
UPDATED_WHEN tells you when the vendor last refreshes the normalized value: Always, Offline, or Upon_Command. If an attribute only updates offline, its normalized column is stale between self-tests, which is another reason to read the raw column.
RAW_VALUE is the counter itself, and it is the column that carries real meaning. It is also the column where vendor differences bite hardest. On most drives a value of 0 in ID 5 means nothing has needed remapping. On some SSDs the raw field is encoded rather than literal, which is why checking the vendor’s own documentation matters for anything but the first few IDs.
NVMe devices print a completely different structure. Instead of an attribute table you get labeled fields: critical warning, temperature, available spare, percentage used, data units written, power cycles, power on hours, unsafe shutdowns, and media and data integrity errors. There is no normalized column and no threshold column at all, which removes the misleading part of the ATA layout entirely.
How to Read SMART Data on Windows
Windows has no built-in smartctl, so you have three realistic routes. The differences between them matter because each one shows you a different amount of detail.
CrystalDiskInfo is the GUI most people expect, and for a quick look it works well. It lists every fixed disk, shows a health status, and gives you a dropdown with raw values per attribute plus a self-test button. Menu labels differ by version: in current builds the menu is called Disk and the self-test entry lives under Advanced, with separate short and extended options. Treat the health percentage it displays with suspicion for the reasons above, and read the raw column instead.
PowerShell is the built-in route and needs no installation. Get-PhysicalDisk gives you a health status and operational state per disk, and Get-Disk gives you the model and serial numbers you need to match them to physical bays:
Get-PhysicalDisk | Select-Object DeviceId, FriendlyName, MediaType, HealthStatus, OperationalStatusWindows Management Instrumentation exposes the same pass or fail verdict that smartctl -H returns:
Get-WmiObject -Class Win32_DiskDrive | Select-Object Model, SerialNumber, StatusThe catch with both commands is that Status is a summary string, usually OK. It tells you the drive has not tripped a catastrophic flag and nothing else. To get actual counters from the command line on Windows you need smartmontools for Windows, a vendor utility, or a third-party tool such as HWiNFO in sensor-only mode.
Vendor utilities remain the most accurate source on Windows for SSD wear data, because they decode the controller-specific meaning of the raw values. If you have an Intel, Samsung or Crucial drive, its own tool usually shows more about remaining endurance than any generic reader will.
What to Understand in Common SMART Attributes

These are the fields worth building your reading habits around. The verdicts are deliberately conservative, because the cost of backing up a healthy drive is far lower than the cost of a disk that stopped spinning.
| Attribute | Healthy | Watch closely | Replace or back up now |
|---|---|---|---|
| Reallocated Sector Count (ID 5) | 0 | 1 to 50 and not climbing | Any value that rises week to week, or 100 plus |
| Current Pending Sector (ID 197) | 0 | Non-zero but stable after a recheck | Any non-zero value at all |
| Offline Uncorrectable (ID 198) | 0 | 1 | Anything above 1 |
| Power On Hours (ID 9) | Under 20000 for an HDD | 20000 to 40000 | Not a verdict on its own, but start planning a replacement |
| Reallocated Event Count (ID 170) | 0 | 1 to 10 | Climbing steadily |
| Spin Retry Count (ID 10) | 0 | 1 | Any value above 0 |
| Reported Uncorrect (ID 187) | 0 | 1 | Anything above 0 |
| Airflow Temperature (ID 190) | Under 45 C | 45 to 55 C | Sustained above 60 C |
Those numbers describe mechanical drives. SSDs expose different fields through the NVMe health log, and the direction of each counter matters as much as its value:
| NVMe field | What it means | What a bad reading looks like |
|---|---|---|
| Critical Warning | Bit field of failure conditions the vendor considers urgent | Any value above 0 |
| Percentage Used | Consumed endurance, roughly the inverse of life remaining | 100 percent means the rated write endurance is spent, not that the drive dies today |
| Available Spare | Remaining spare capacity as a percentage | Below 10 percent, or falling |
| Data Units Written | Count in units of 512000 bytes each | Compare against the rated TBW to compute consumed endurance |
| Unsafe Shutdowns | Power losses without a clean shutdown | Rising steadily alongside other errors |
| Media and Data Integrity Errors | Unrecoverable data errors found by the controller | Anything above 0 |
| Power On Hours / Power Cycles | Age in hours and in spin-ups | Very high cycles with low hours points to aggressive power management |
The single most common SSD misunderstanding is the direction of Percentage Used. It counts up toward 100 as the drive ages, so it is the opposite of a life-remaining figure. A drive at 20 percent used is nearly new. A drive at 100 percent used has written everything the vendor guaranteed, and its failure probability climbs sharply from there even though most such drives keep working.
SATA SSDs report a wear figure under attribute ID 177 or 231 depending on the controller, and the encoding is rarely a plain percentage. Do not assume ID 177 means “23 percent worn” because on a great many drives it does not.
How old is too old? Here is the rough community line, useful for a used-drive purchase decision:
| Drive class | Comfortable | Getting old | Plan a replacement |
|---|---|---|---|
| Consumer mechanical HDD | Under 15000 hours | 15000 to 40000 hours | Above 40000 hours |
| NAS-rated mechanical HDD | Under 30000 hours | 30000 to 50000 hours | Above 50000 hours |
| SATA SSD | Percentage Used below 20 percent | 20 to 80 percent | Above 80 percent |
| NVMe SSD | Percentage Used below 30 percent | 30 to 90 percent | Above 90 percent |
| Enterprise SSD | Under 40 percent used | 40 to 80 percent used | Above 80 percent used |
Why SMART Values Must Be Compared Over Time
A single snapshot tells you almost nothing on its own. The counter that matters most is the one whose value changed since last time you looked, and that requires a second data point.
The practical method is boring: run the full command on a schedule, keep the output, and diff the raw columns. A weekly cron entry writing smartctl -a output to a dated file gives you a year-long history you can graph. What you are hunting for is a counter that is not merely non-zero but moving upward.
Distinguish two shapes of change. A gradual rise in wear counters, or a slowly falling normalized value, is ordinary aging and it tells you about your replacement timeline. A sudden jump, where reallocated sectors go from 0 to several hundred overnight, indicates an acute problem, usually physical damage, thermal stress or a failing head assembly.
The rule I apply: any attribute that increased since the last reading gets investigated the same day, regardless of how small the number is. Users on hardware forums consistently report that a single new reallocated sector preceded failure far more often than the raw count would suggest. People with tens of thousands of reallocated sectors and flat graphs have driven drives for years; people whose count went from zero to one and then kept moving have had a bad year.
What to Do When SMART Reports a Warning
Work through this in order, and do not reorder it. The instinct to diagnose first is what loses data.
- Back up now, before any further commands. Start the copy. A pending sector means the drive already failed a read and decided not to remap it, and the next read is not guaranteed to succeed. Everything below this line matters less than the copy.
- Confirm which drive and which attribute. Match the serial number from
smartctl -iagainst your inventory. A NAS reporting an abnormal status while a utility calls the same disk healthy usually means the two are reading different drives or the controller is filtering counters. - Re-read the counters. A single pending sector can be a one-off read failure. Run the short self-test and read the table again. If the value returned to zero and nothing else moved, monitor weekly. If it is still there, treat it as real.
- Run the extended self-test. This is where fresh errors often surface that a short test or a filesystem repair glossed over. Read the self-test log afterwards and check the error log.
- Check temperature and airflow. A drive running hot will produce reallocated sectors as a thermal symptom, and fixing airflow can genuinely stop the growth.
- Decide on a replacement window. If the counter is climbing, you are on a clock regardless of how good the drive feels today. Schedule the replacement, then keep backing up until it is done.
If SMART is unreadable rather than bad, that is a different problem. USB enclosures frequently block SMART passthrough, RAID controllers often report only a synthesized pass or fail, virtual machines see an emulated disk with no SMART capability at all, and cloud block volumes return nothing. If smartctl errors out or returns an empty attribute table, test the same drive directly on SATA before concluding the drive is fine, because an absent reading is not a passing one.
What SMART Data Cannot Tell You
A passing SMART report means no pre-failure threshold has been crossed. It does not mean the drive is healthy, and plenty of drives have failed outright while reporting a clean bill of health right up to the failure.
The reason is that thresholds are conservative by design. Vendors set them where a drive is already degrading badly, because a false positive on a warranty replacement costs far more than a slightly early warning. Anything outside those thresholds is invisible to the system, which is why mechanical problems like a failing read head or a motor bearing can develop with zero warning in the counters.
The other limit is granularity. SMART describes mechanisms, not causes. A rising reallocation count says sectors are being retired, not why, and the practical causes range from ordinary aging to a drop, a thermal event or a manufacturing defect. Likewise, a drive reporting perfect wear figures can fail from a controller firmware bug, and a drive with a high reallocation count can keep running for years.
The honest summary is that SMART data is one input among several. Treat it as an early warning system with a high false-negative rate, and pair it with backups rather than relying on it as a replacement for them. Forum users who lost data to a drive that reported PASSED right up to the failure are not unusual, and that experience is exactly why.
Frequently Asked Questions
What is the difference between raw and normalized SMART values?
The normalized value is a vendor formula that scales remaining life into a 1 to 254 range, and it is what most GUIs display as a health percentage. The raw value is the literal counter the drive recorded, such as the actual count of reallocated sectors or hours powered on. The raw value carries the diagnostic information. The normalized value is useful for spotting direction of change, but on many SSDs its formula is a rough restatement of temperature or wear, so read the raw column and treat the percentage as a rough indicator.
How many reallocated sectors is too many?
One new reallocated sector matters more than a large static number. Drives tolerate thousands of reallocated sectors and run for years when the count holds steady, because the drive successfully retired those sectors and moved on. The alarming pattern is a count that climbs between readings, since that means the firmware is actively remapping new bad sectors. Track the trend weekly rather than reacting to a single figure, and start planning a replacement when you see the second sector appear.
Does a SMART PASSED result guarantee the drive is healthy?
No. PASSED means no attribute has crossed the vendor’s pre-failure threshold, and those thresholds are deliberately conservative so they rarely trigger a false alarm. Mechanical faults such as a failing read head or a worn motor bearing do not map cleanly onto any counter and can develop with SMART reporting clean the whole time. The same applies to controller firmware faults on SSDs. Keep backups on a schedule, and use SMART readings to inform that schedule rather than to replace it.
Why can’t I read SMART data from my external hard drive?
Most external enclosures use a USB to SATA bridge chip that does not pass SMART commands through, so the drive reports nothing useful. Some modern enclosures do support it, but you usually need to add a -d sat option or a device type hint such as -d sat,12 or -d auto. RAID controllers frequently expose only a synthesized pass or fail status rather than the attribute table. If passthrough stays blocked, connect the drive directly to a SATA port, or check whether the enclosure supports S.M.A.R.T. at all.
What does NVMe Percentage Used mean when it reaches 100?
Percentage Used counts consumed endurance upward, so it is the opposite of a life-remaining figure. A drive at 20 percent has barely touched its rated write capacity, while one at 100 has written everything the vendor guaranteed. Reaching 100 does not mean the drive dies that day, and many keep running for thousands of hours afterwards. It does mean the failure curve steepens noticeably, so treat it as a replacement planning signal rather than an emergency, and keep monitoring media and data integrity errors.
How many power-on hours is too many for a hard drive?
For a consumer mechanical drive, power-on hours are the clearest age signal available. Under 15000 hours is comfortable, 15000 to 40000 is the getting-old band where failures start appearing in real numbers, and above 40000 hours most people plan a replacement whether or not the drive feels fine. NAS-rated drives are built for longer service and can run 50000 hours or more. Hours alone never predict failure, so weigh them together with reallocated and pending sector counts.
Conclusion
Identify the drive and capture its full identity, take a baseline reading with sudo smartctl -a or CrystalDiskInfo, and then judge the raw counters in the context of what they were last month rather than against a single threshold. Any counter that grew since your last reading gets a backup the same day. Schedule the weekly check so next year’s decision is made from a trend instead of a panic.