Print statements feel productive because you type a line, hit run, and read the output. The problem is that the cycle never ends: you add a print, rerun, scroll back through noisy logs, delete it, and add two more. Learning how to use a debugger instead of print statements replaces that ritual with four moves — set a breakpoint, inspect the state, step through the code, and continue.
A debugger is a tool that pauses a running program at a line you choose, shows you every local, global, and object value at that exact moment, and lets you evaluate expressions or step forward one line at a time. You see the whole live state of the program without editing a single line of source.
The core loop, which works almost identically in every language and IDE:
- Set a breakpoint on the line just before the value goes wrong.
- Run the program in debug mode until execution stops there.
- Inspect the variables panel, the call stack, and any object property you care about.
- Step over, step into, or step out to follow control flow.
- Evaluate expressions in the debug console, add a watch expression, then continue to the next breakpoint.
Here is the honest comparison. Every row is a decision you will actually face during a debugging session.
| Decision | Print statements | Debugger |
|---|---|---|
| Cost to add a probe | Edit a line, rerun, then edit it back out | Click the gutter, delete nothing |
| State you can see | Only the values you chose to format | All locals, globals, fields, and closures |
| Repeatable | Copy and paste the line again next time | Breakpoint persists until you remove it |
| Inside a 100000-iteration loop | Output flood, slow run | Conditional breakpoint or hit count |
| Works in production | Yes, with a log pipeline | Only with a deliberate attach and real risk |
| Review risk | Stray prints get committed and shipped | No source change to review |
Table of Contents
- What You Need
- Which debugger to use, by language
- Step-by-Step: How to Use a Debugger Instead of Print Statements
- 1. Reproduce the Problem With a Minimal Test Case
- 2. Set a Breakpoint Near the Suspect Code
- 3. Inspect Variables Instead of Printing Them
- 4. Step Through the Execution Path
- 5. Use the Call Stack to Find the Caller
- 6. Add Watch Expressions and Temporary Breakpoints
- 7. Remove Diagnostic Noise and Verify the Fix
- Common Mistakes
- Breakpoints that never hit
- Stepping through everything
- Mutating state while you inspect
- Debugging a timing or concurrency bug by stepping
- Leaving debug output in the codebase
- When print statements are still the right answer
- Frequently Asked Questions
- How do I use a debugger?
- Why might you use print statements when debugging code?
- Can you give me some examples of debuggers?
- What are the two types of debugging?
- Why is my debugger not hitting my breakpoint?
- Can you attach a debugger to a running process?
What You Need
You need four things, and you probably already have three of them.
A source checkout you can run. The same branch that fails in CI or on your machine, with the failing input available. A debugger cannot help with code you cannot reproduce.
A deterministic test case. One input, one command, one wrong output. If the result changes depending on the minute you run it, you have a state or timing bug, and a debugger is the only tool that can show you the difference.
A debugger that speaks your language. Any modern editor has one built in. Which one you pick matters far less than whether it can step into your own code, not just library code.
The runtime details that break debuggers. Know the language version, whether the code runs in a container or a VM, and whether the process is started by a test runner, a web server, or a scheduler. That last detail decides whether you can attach to a running process or must launch under the debugger instead.
Which debugger to use, by language
This is the part most tutorials skip. Every language has a default answer, and the launch command is usually one line.
| Language | Debugger | How to start it |
|---|---|---|
| Python | pdb or ipdb | Add breakpoint() on its own line, or run python -m pdb script.py |
| JavaScript / Node.js | Chrome DevTools or node inspector | Run node --inspect-brk script.js and open the DevTools debugger |
| Java / Kotlin | IntelliJ debugger or jdb | Run a debug configuration from the IDE, or jdb -attach <port> |
| Go | Delve | dlv debug ./cmd/server, then dlv attach <pid> for a running binary |
| C / C++ on Linux | gdb | gdb ./a.out, then break main and run |
| C / C++ on macOS | lldb | lldb ./a.out, then breakpoint set --name main |
| C# / .NET | Visual Studio or dotnet-dump | Press F5 in Visual Studio, or dotnet-dump collect then dotnet-dump analyze |
| Ruby | byebug | byebug as a statement, then continue to resume |
Windows, macOS, and Linux all support this workflow. The differences are mostly in the native toolchain: gdb dominates on Linux, LLDB ships with the macOS command line tools, and on Windows the Visual Studio and Visual Studio Code debuggers handle managed code most comfortably. If you have ever wondered how to use a debugger instead of print statements on Windows specifically, the gutter click and F5 key are the same as on any other platform.
Step-by-Step: How to Use a Debugger Instead of Print Statements
1. Reproduce the Problem With a Minimal Test Case
Before you open the debugger, get the failure down to one command with one input. Shrink the input until the wrong answer is still wrong, because a smaller input means fewer loop iterations before the breakpoint and a faster answer.
Then note what the wrong result actually is. “It does not work” gives the debugger nothing to aim at; “the total is 42 when it should be 91” tells you which variable to watch. Identify the first place the value becomes incorrect, not where the error is finally raised. Exceptions travel; a wrong number does not move on its own.
How to tell it worked: the same command produces the same wrong result twice in a row. If it does not, fix the non-determinism first.
2. Set a Breakpoint Near the Suspect Code
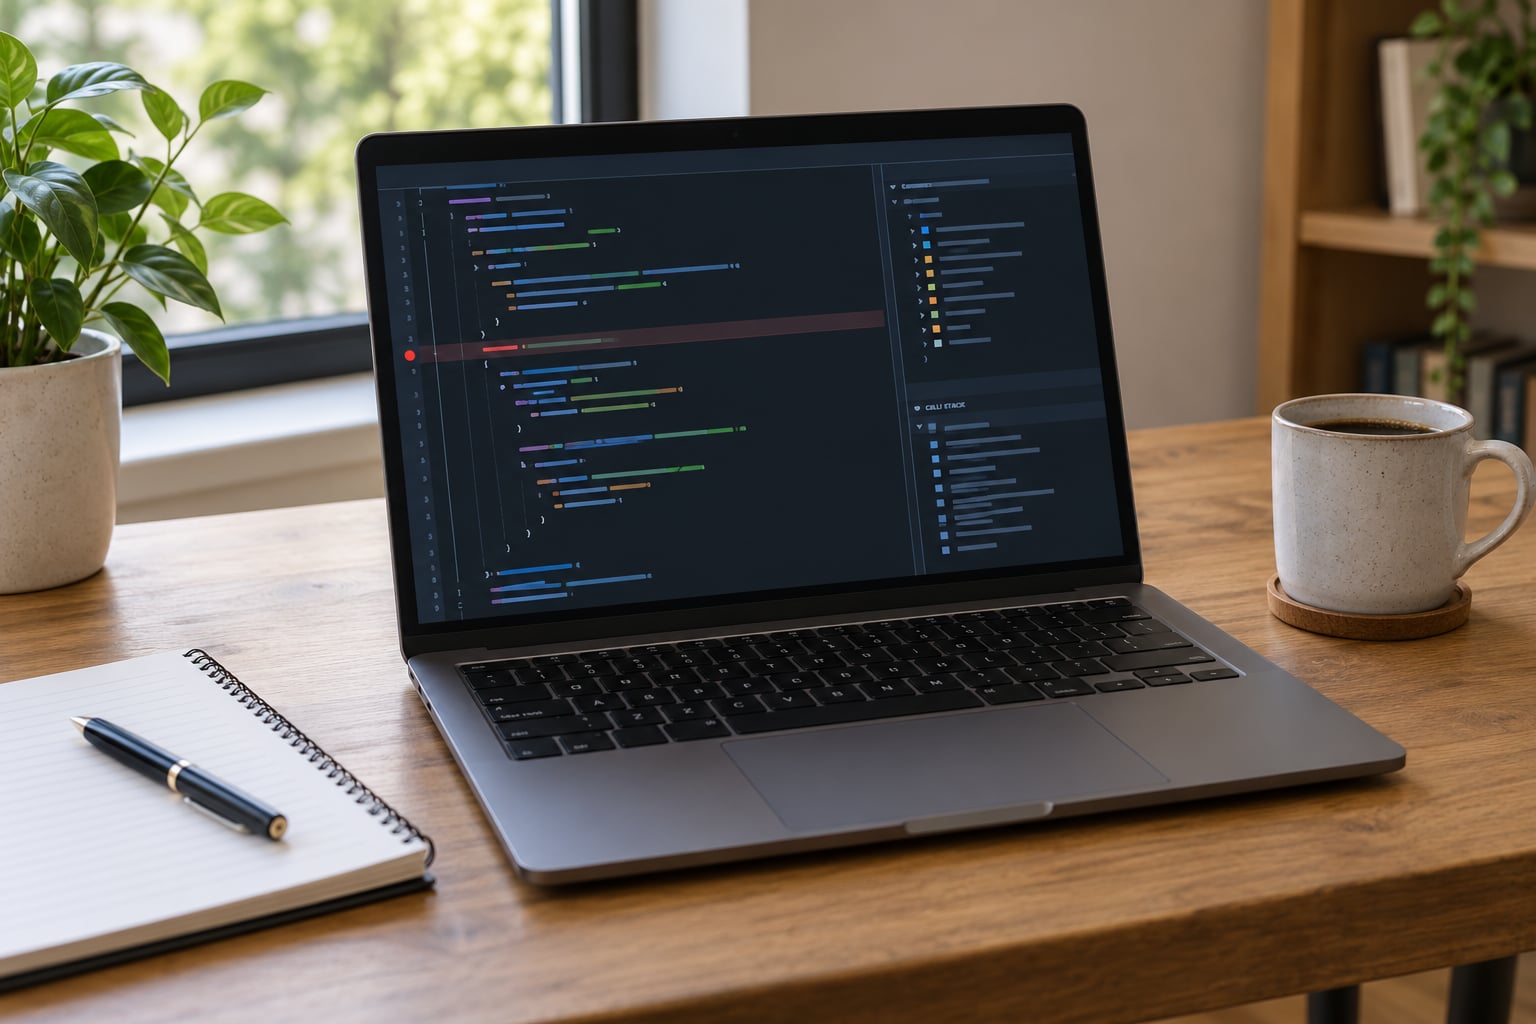
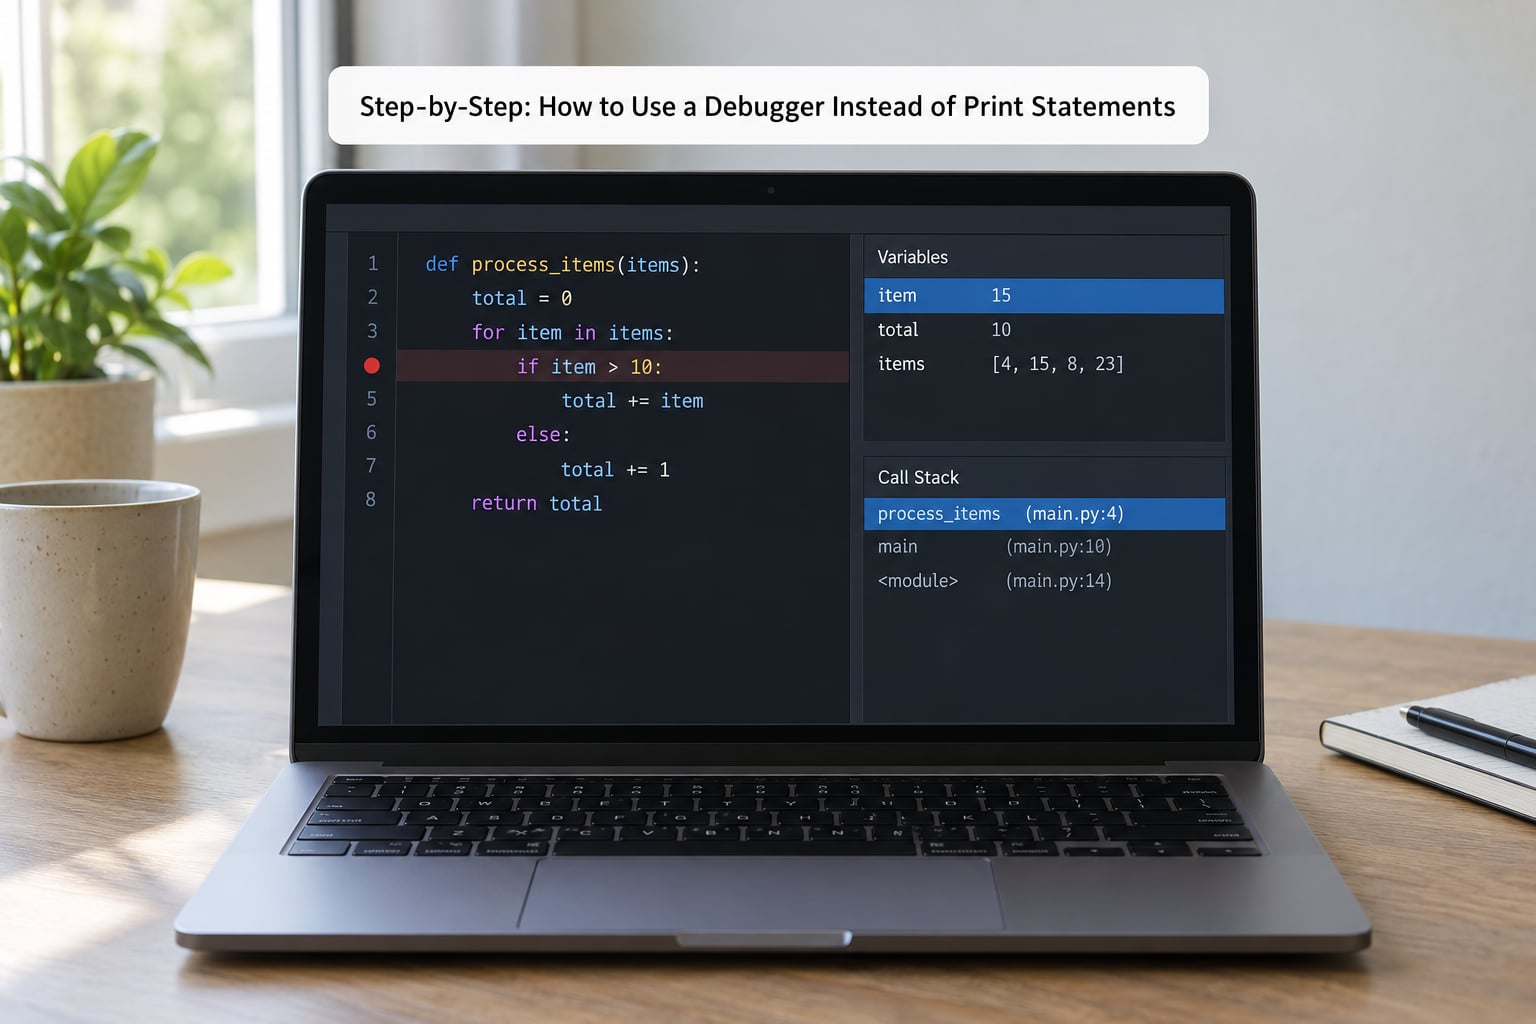
A breakpoint is a marker that tells the runtime to suspend execution on that line. In VS Code, IntelliJ, PyCharm, and Visual Studio, you click the narrow strip of editor margin next to the line number and a red dot appears. In a command-line debugger you type the equivalent, such as break 42 in gdb or b main.c:42 in lldb.
Place it on the line before the value turns wrong, not on the line where you noticed the problem. Breakpoints suspend before the line runs, so a marker on the bad line shows you the state that produced it but not the result.
When the same function runs hundreds of times, a plain breakpoint stops you every time. Right-click the marker and add a condition such as user_id == 4471, or set a hit count so the debugger stops on the 500th pass and lets the rest run. In Python you can also type breakpoint() directly in the source when you are already in a terminal and no IDE is in sight.
How to tell it worked: the program pauses on the expected line, and the editor highlights the current statement rather than just showing a dot.
3. Inspect Variables Instead of Printing Them
This is the step that replaces most of your print statements. When execution stops, the variables panel shows every local variable and argument in the current scope, plus globals, module state, and the values of the object you are standing inside.
Expand an object and you can read individual fields without writing a loop. For an array or a map, the debugger can show length, slice, and search. A hover tooltip gives you the same values inline while the program is paused.
You are not limited to stored values. The debug console evaluates arbitrary expressions in the current scope, so you can call a method, index into a collection, or run a comparison to test a hypothesis in one step:
# paused inside calculate_totals(cart)
cart.items[3].price
len(cart.items)
sum(i.price * i.qty for i in cart.items)
Be careful with anything that mutates state. Calling a setter, a getter with lazy caching, or a function that sends a request from the console can change what you are about to step into, and you will end up chasing a bug you created in the debugger itself. Read first, mutate later, and restart the run if you are unsure.
How to tell it worked: you can answer the question that sent you into the code without adding a single line to the file.
4. Step Through the Execution Path
Stepping is how you see the shape of the program rather than just its values. The same four controls exist under different names in every IDE, and the differences trip up nearly every beginner.
| Control | What it does in plain English | Use it when |
|---|---|---|
| Step over | Runs the next line and stops, without entering the functions it calls | You care about this function, not the helpers |
| Step into | Jumps inside the call on the next line | You suspect the function you are about to call |
| Step out | Finishes the current function and pauses in the caller | You are three frames deep and need to go back up |
| Continue | Runs until the next breakpoint or the end | You have the answer and want the next one |
| Run to cursor | Runs to the line your cursor sits on and stops | You know the line that matters and are 200 steps away |
Step over vs step into is the single most common confusion. The rule of thumb: step into code you wrote, step over code you did not. If you are inside your own parser and it calls a library function, step over the library call and stay in your logic.
Watch for a trap: stepping changes timing. A race condition or a timeout bug can disappear the moment you single-step, because the pause gives the other thread time to finish. If the bug vanishes when you step, that disappearance is itself the clue. Confirm the fix with a test that reproduces the failure, not with a manual run that no longer fails.
How to tell it worked: you reached the line where the value is wrong and can describe, in one sentence, what the state looked like when it changed.
5. Use the Call Stack to Find the Caller
The call stack panel lists the chain of function calls that led to where you are now, with the current frame on top. Each frame is a stack frame: it holds that function’s arguments, locals, and the line it is currently executing.
Click a frame higher up to inspect what that caller passed down. This is faster and far more reliable than adding a print at the top of five functions to see which one supplied a bad argument. The call stack answers the question directly, and it costs one click.
Two habits make this much stronger. First, select a frame and look at the value of the parameter you care about before you step deeper, because the bug is often already visible one level up. Second, when you find the caller that passed the wrong thing, put a breakpoint there and run again rather than reasoning forward from the current frame.
How to tell it worked: you can point at one line in one caller and name the bad value it sent.
6. Add Watch Expressions and Temporary Breakpoints
A watch expression is re-evaluated every time execution pauses, so you can track a value across a loop without stopping inside it. Watch something like len(processed), current_user.id, or retry_count and keep stepping; the watch list shows the history of how it changed.
Not every breakpoint should stop the program. A logpoint, also called a logging breakpoint, prints a message and runs on without suspending. In VS Code, right-click the gutter, choose Add Breakpoint, then Add Logpoint, and write the message with expressions inline. JetBrains calls the same thing Evaluate and Log and adds a pass count so you can log only the 100th occurrence.
Temporary breakpoints are the opposite trick. They delete themselves after the first hit, which is ideal for a branch that only fires on a rare input you have to run ten times to catch.
| Breakpoint type | What it does | When it earns its place |
|---|---|---|
| Line breakpoint | Stops on that line, every time | Your default tool for state and flow |
| Conditional breakpoint | Stops only when an expression is true | Hot loops, one specific record, one branch |
| Logpoint | Prints a message and keeps running | You want the data but not the interruption |
| Hit count | Stops or logs on the nth pass | Finding which iteration breaks |
| Exception breakpoint | Stops the moment anything is thrown | Catching a swallowed or wrapped error |
| Temporary breakpoint | Removes itself after one hit | Rare code paths you keep missing |
Exception breakpoints are worth their own habit. Many codebases catch an exception, log nothing, and return a default, which is why a failure shows up three layers away. Break on all thrown exceptions once and you will find the original in a few seconds.
How to tell it worked: you have watched a value change across many iterations without editing code or drowning in output.
7. Remove Diagnostic Noise and Verify the Fix
The whole point of the switch is that the source file never changes. When you finish, your diff should contain the fix and nothing else: no prints, no temporary logging, no commented-out lines you forgot about.
Rerun the failing test case, then write it as a permanent test so the same bug cannot come back quietly. If the fix is in a function with a watch list full of ad hoc expressions, discard them; they live in the debug session, not in the file.
Then guard the habit. A lint rule or pre-commit hook that fails on leftover debug calls (a bare print, console.log, fmt.Println) costs ten minutes once and saves every future review. Search your repository history for a leaked debug statement at some point, just so you know what the failure looks like.
How to tell it worked: the test suite passes, the diff is small, and the debugger session closed without leaving a trace in version control.
Common Mistakes
Breakpoints that never hit
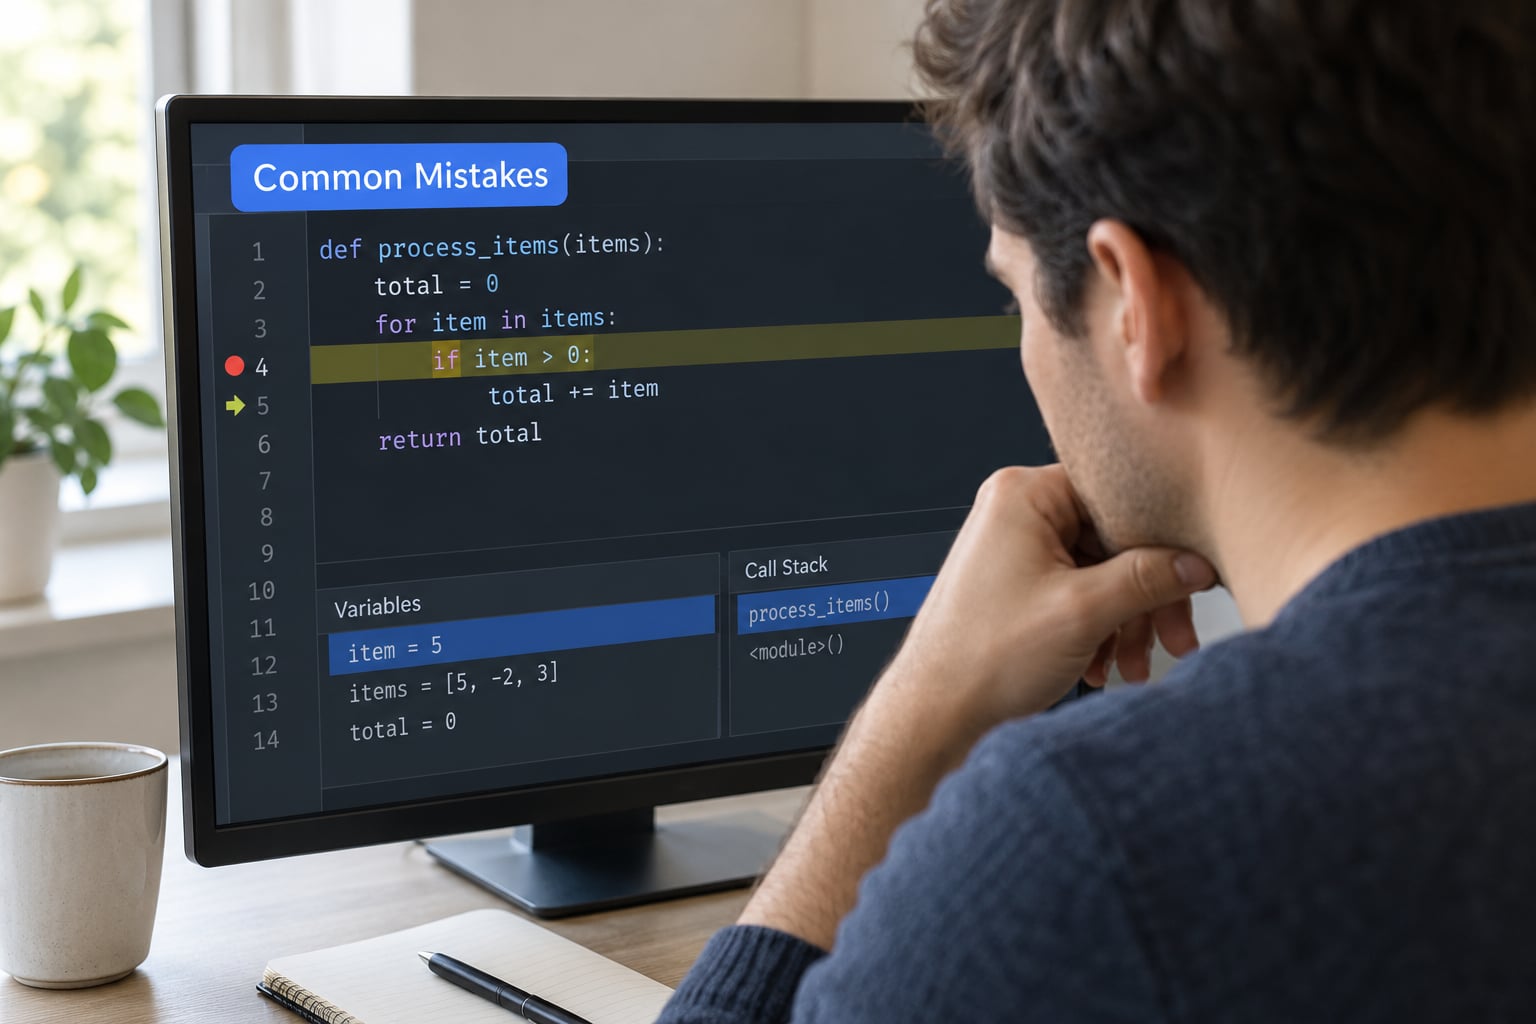
Four causes cover almost every case. You are running a stale build or a different file than the one you have open, the code path is not actually reached, the line sits inside a process the debugger is not attached to, or the program is failing before it gets there. Confirm the build first, then set the breakpoint on the line that throws rather than where you think the flow starts. Optimized or minified builds also strip the symbols a debugger needs, so disable optimization while you investigate.
Stepping through everything
Single-stepping a 400-line request handler to reach one branch is slower than reading the code, and it distorts timing while it does it. Set a breakpoint near the suspicious branch and run to it. Save stepping for the five lines around the bug, not for the path that gets you there.
Mutating state while you inspect
Calling anything with a side effect from the debug console changes the program you are trying to observe. Lazy loaders, caches, and setters all bite here. If a value changes the moment you inspect it, stop, restart the run, and inspect without calling anything.
Debugging a timing or concurrency bug by stepping
Pausing freezes one thread and gives the others time to catch up, so the race stops happening. The right tools there are a logpoint, a thread or task view that shows all stacks at once, or a deterministic test that reproduces the ordering. Stepping is the wrong instrument for a bug that depends on time.
Leaving debug output in the codebase
Print statements that survive a fix become noise in production logs, can leak data into output you did not mean to expose, and get reviewed line by line by a colleague who has no idea what you were chasing. Delete them the moment the run is over, then add the lint rule from step 7 so the next slip never reaches a pull request.
When print statements are still the right answer
Plenty of experienced developers barely touch a debugger for day-to-day work, and they are not wrong about it. Structured logging wins in production and in containers, where you cannot attach a debugger without a deliberate, risky change to a running process. A log line survives the request; a breakpoint does not. A ten-second check on a value that never changes also does not need a full session. The pragmatic split most teams land on: debugger for logic, state, and recursion while the code is in front of you, logging for anything that outlives your machine.
Frequently Asked Questions
How do I use a debugger?
Set a breakpoint on the line just before the value you expect to be wrong, then run the program in debug mode instead of normally. When execution stops, open the variables panel to read every local, global, and object value in scope, and check the call stack to see who called the current function. Step over lines you do not care about, step into your own functions, then continue to the next breakpoint. Nothing in your source file changes during any of this.
Why might you use print statements when debugging code?
Print statements are faster to reach for, need no setup, and work anywhere, including production servers and containers where attaching a debugger is impractical or off limits. A single log line can tell you a request arrived, which user it was for, and what the response was, long after the process ends. Most teams use both: the debugger for logic and state while they are editing code, and logging for anything that happens in an environment they cannot open.
Can you give me some examples of debuggers?
Python developers use pdb or ipdb, started with a breakpoint() call in the source. JavaScript and Node.js use the Chrome DevTools debugger or the built-in node inspector. Java developers usually debug from IntelliJ IDEA, with jdb on the command line. Go uses Delve, C and C++ use gdb on Linux or lldb on macOS, and C# and .NET use the Visual Studio debugger. Most editors ship with all of these wired up already.
What are the two types of debugging?
The first is user-level or black-box debugging: you know the wrong input and the wrong output, and you look for the cause without reading the code. The second is white-box debugging: you have the source and the tools to inspect it, which is what breakpoints and step-through execution give you. Unit tests and assertions are a related third category, since they check behavior automatically rather than investigating it by hand.
Why is my debugger not hitting my breakpoint?
Check the order of operations first: you must start the program in debug mode, not run it normally. Then confirm you are looking at the file the process actually loaded, since a stale build or a different copy of the module is the most common cause. Optimized or minified builds also strip the debug symbols the debugger needs. If the line is inside a callback or a loop, add a condition and verify that the branch is reached at all.
Can you attach a debugger to a running process?
Usually yes, and it is the standard way to debug a server. Delve has dlv attach for Go, gdb and lldb can attach to a process ID, and Node.js exposes the inspector with the inspect flag, while the Node inspector protocol and most IDEs handle the rest. In a container, forward or expose the debug port and attach from your editor. In production, weigh it carefully: attaching pauses every thread, so use a canary or a small traffic slice rather than the whole fleet.
Start with one bug today. Reproduce it, drop a breakpoint on the line just above where the value goes wrong, and read the variables panel. Once the call stack and the watch list click for you, the print statements will not be missed.