Wireshark is a free, open-source network protocol analyzer that copies the packets moving across a network interface and lets you read them one at a time, layer by layer. This guide covers how to use Wireshark for beginners: installing it, picking the right interface, capturing traffic, filtering it down to something readable, and saving the result. A first session takes roughly 30 minutes and needs no background beyond knowing what a web address is.
Before you start: capturing traffic on a network you own or administer is fine. Capturing on someone else’s network without permission is wiretapping in most countries, including on a shared Wi-Fi network you happen to be connected to. Everything below stays on your own machine or your own router.
Table of Contents
- What You Need
- Step-by-Step
- 1. Install Wireshark and Check Your Permissions
- 2. Choose the Correct Network Interface
- 3. Start Capturing Packets
- 4. Read the Main Packet List
- 5. Inspect Packet Details and Follow a Conversation
- 6. Use Display Filters and Capture Filters
- 7. Save, Export, and Troubleshoot
- Common Mistakes
- Frequently Asked Questions
- Do I need administrator rights to use Wireshark?
- Which network interface should I capture on?
- What is the difference between a capture filter and a display filter?
- Can Wireshark decrypt HTTPS traffic?
- Is it legal to capture traffic on my home network?
- Conclusion
What You Need
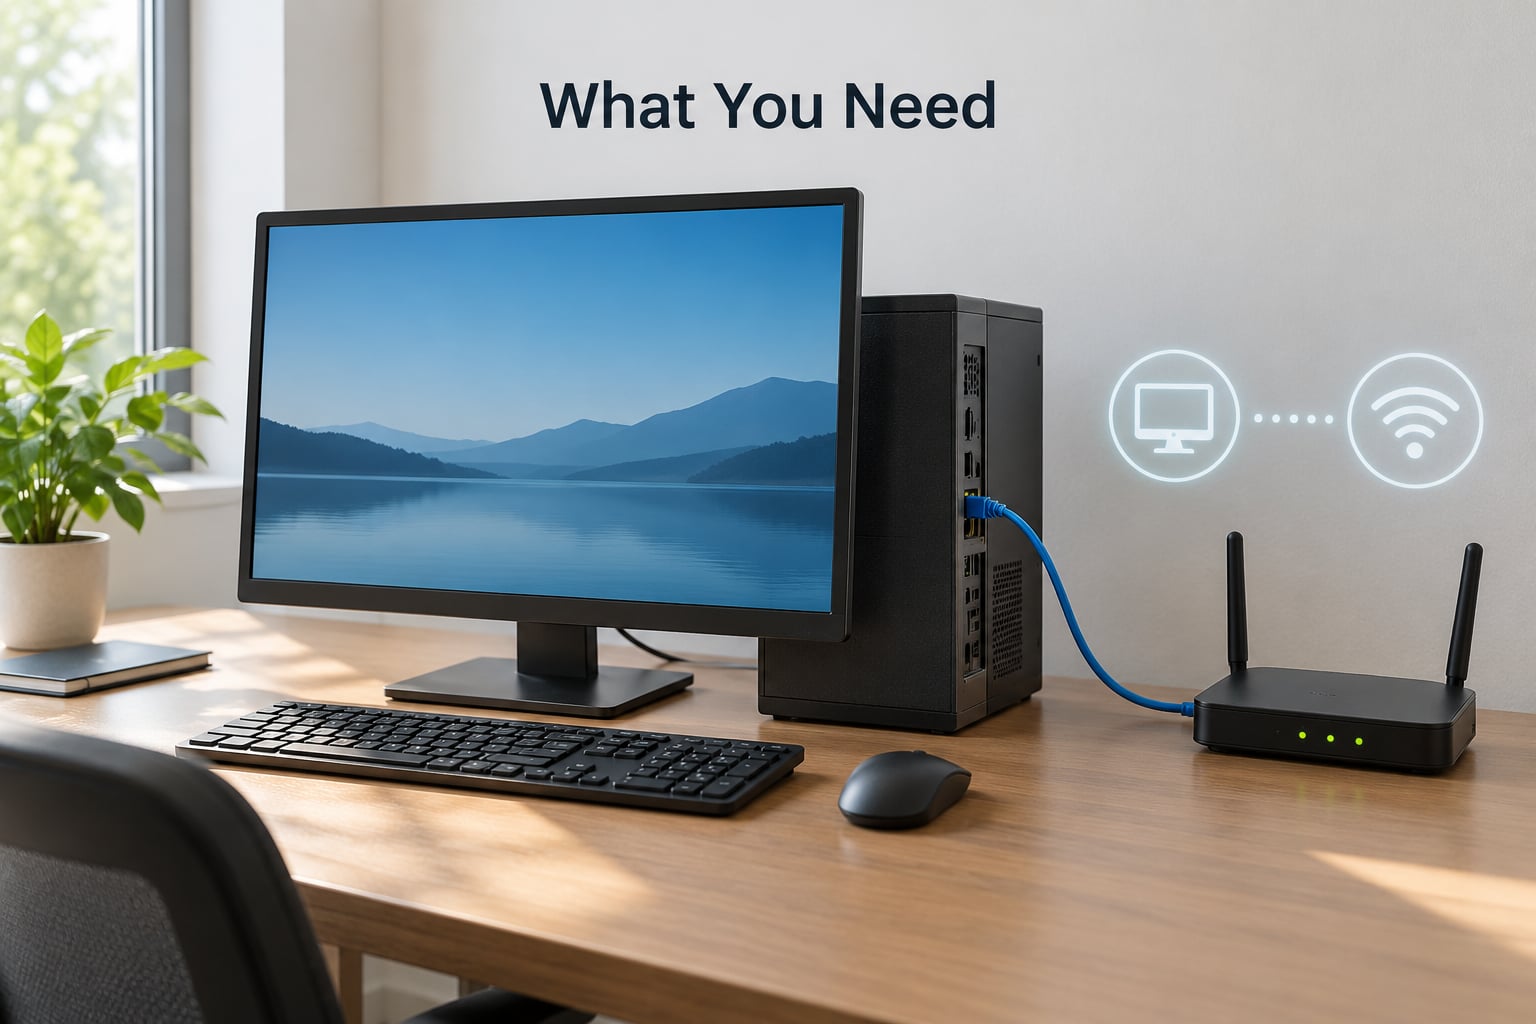
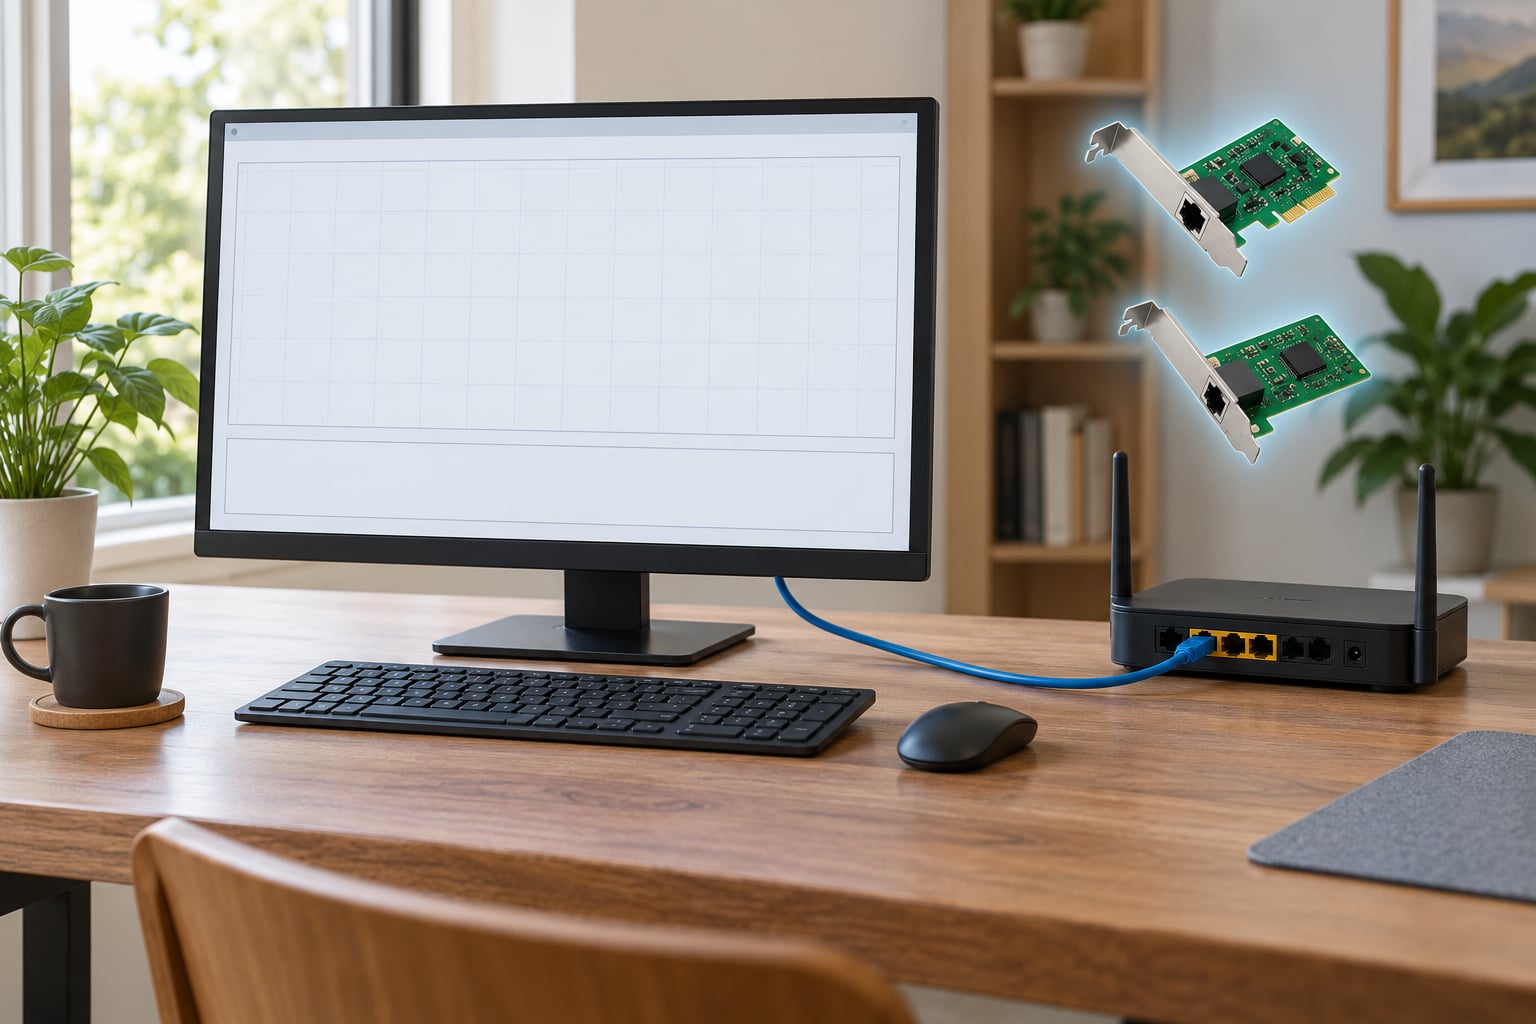
You need a computer with roughly 200 MB of free disk space, administrative rights, and a network interface that carries traffic you care about. That last part trips up most newcomers, so it is worth getting straight: the Ethernet port you are wired through, the Wi-Fi adapter you are connected with, and a dozen virtual adapters from Docker, VMware, or a VPN are all listed side by side, and picking the wrong one gives you an empty capture.
Each operating system also needs its own capture driver, because reading raw packets requires permissions the normal user account does not have.
| Operating system | Capture driver | Extra step | Common failure |
|---|---|---|---|
| Windows 10 or 11 | Npcap | Accept it in the installer; run Wireshark as Administrator if no interfaces appear | Installer option unchecked, so the app opens with an empty interface list |
| Linux (Debian, Ubuntu) | dumpcap, run from the wireshark group | Add your user to the wireshark group, then log out and back in | Capture works only with sudo, or the interface list is greyed out |
| macOS | ChmodBPF | Allow ChmodBPF in System Settings, Privacy & Security | Permission prompt ignored, so nothing captures without a password prompt |
On Linux, the group setup is three commands, and you must start a new login session before it applies:
sudo apt update && sudo apt install wireshark -y
sudo usermod -aG wireshark $USER
sudo setcap cap_net_raw,cap_net_admin=eip /usr/bin/dumpcap
On macOS, Homebrew installs the app, then you grant ChmodBPF access in System Settings under Privacy & Security:
brew install --cask wiresharkThe loopback interface (lo0 or lo) only carries traffic between programs on your own machine, which is exactly what you want when testing a local server. Virtual adapters named VMware, VirtualBox, Hyper-V, Docker, or WSS are usually quiet, and picking one is the single most common reason a beginner sees nothing.
Step-by-Step
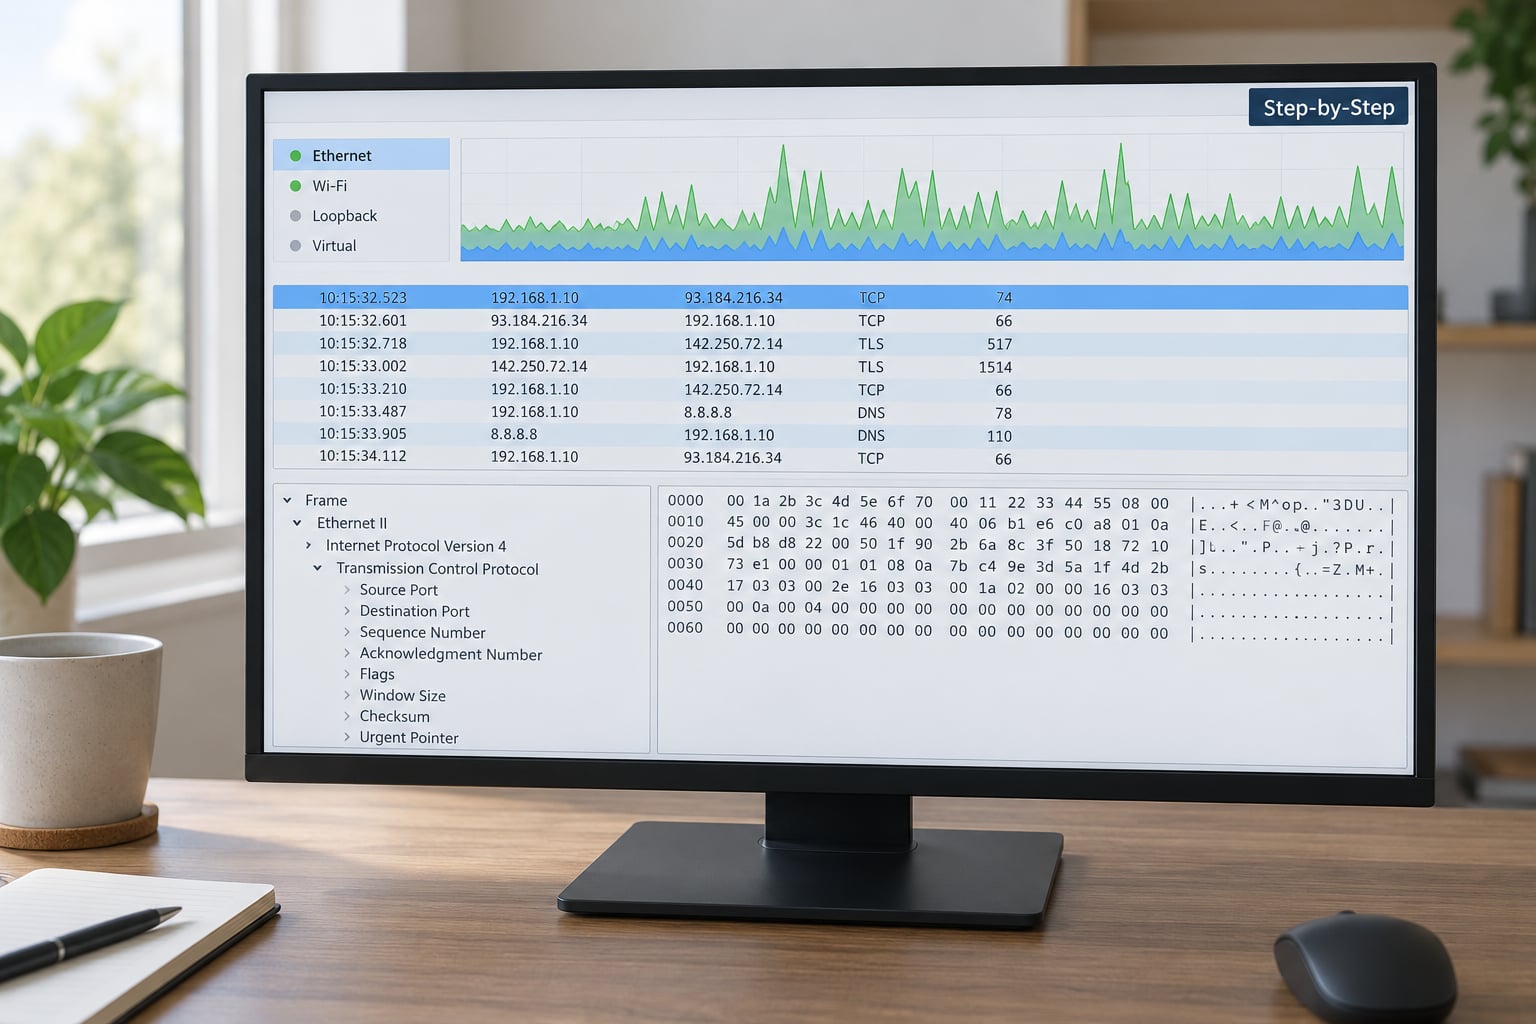
Below is the workflow I walk new users through: install, choose an interface, capture, read, filter, save. Each step names what success looks like so you know when to move on rather than guessing.
1. Install Wireshark and Check Your Permissions
Download the current stable release from the official wireshark.org site, run the installer for your operating system, and let it install the capture driver alongside the application. On Windows that means accepting the Npcap prompt rather than skipping past it, because a Wireshark without Npcap launches perfectly and lists zero interfaces.
Launch the app and look at the welcome screen. You should see a list of interfaces with a small activity graph next to each one. If the list is empty, sort out permissions before anything else, since every later step depends on it.
2. Choose the Correct Network Interface
The interface you capture on is the one carrying the traffic you want to inspect. For your own browsing, that is usually the Wi-Fi adapter or Ethernet port in use, and the little graph beside it twitches as packets arrive. Names differ by platform: Windows shows friendly names such as Wi-Fi or Ethernet, Linux shows short names like wlan0, eth0, or en0, and macOS shows en0 plus a list of BSD-style names.
Read the graph for a few seconds before clicking. The interface with visible activity is your machine’s link to the network, and the ones at zero are either disconnected or virtual. To confirm, open a browser on the same machine and watch which graph moves.
3. Start Capturing Packets
Double-click the interface you want, or select it and click the blue shark fin button. Capture starts immediately and the packet list fills in real time. Generate traffic you control by loading a page or running ping -c 5 example.com in a terminal, then click the red square, or press Ctrl+E, to stop.
You should now see dozens to hundreds of rows with times, addresses, protocol names, and lengths. If you expected five pings, look for ICMP rows with the word echo, and if you expected a web page, look for DNS and TLS rows.
Keep captures short while you are learning. Background chatter fills the list, and promiscuous mode, which asks the card to pass along frames not addressed to you, does not help on a switched home network where the switch only forwards your own traffic.
4. Read the Main Packet List
Each row is one packet, and the columns map to the header fields inside it. No. is the row number, Time is the offset from the start of the capture, Source and Destination are the sending and receiving addresses, Protocol is the highest layer Wireshark decoded, Length is the frame size in bytes, and Info is a one-line summary of the notable fields.
Protocol names are the fastest orientation cue. DNS rows show query names, TCP and UDP rows show ports and flag words, TLS rows show handshake types, and ICMP rows show echo request or reply. Reading Info first and expanding a row only when something catches your eye keeps the list readable.
5. Inspect Packet Details and Follow a Conversation
Clicking a row fills the middle pane with a collapsible tree: Frame for size and timing, Ethernet II for MAC addresses, IPv4 for the source and destination IPs and TTL, then the transport protocol, then the application data. Expanding each node shows the actual header fields, and selecting a field highlights the matching bytes in the pane below.
That bottom pane is the packet as it arrived on the wire, shown as hexadecimal with printable ASCII alongside. It looks intimidating, and beginners rarely need it, but it settles arguments: if a field looks empty in the details tree, the bytes tell you whether the value is really zero or the field is not present.
Judging one packet in isolation rarely answers anything. Right-click a row and choose Follow, then TCP Stream or UDP Stream, and Wireshark rebuilds the entire conversation between those two endpoints in a readable pane, with client and server traffic tinted differently. This is where you read a request, its response, and the timing between them.
For a TCP connection, the opening three rows are the three-way handshake: SYN from the client, SYN-ACK from the server, then ACK from the client. A SYN answered with a reset flag means the port is closed, while a SYN with no answer at all means something dropped the packets, and those two cases need different fixes.
6. Use Display Filters and Capture Filters
Two filter languages matter here and beginners mix them up constantly. A display filter runs after capture and hides rows in a file you already have, using a rich expression language. A capture filter runs before recording and decides what gets written to disk at all, using Berkeley Packet Filter syntax with no comparison operators.
| You want | Capture filter (BPF, before capture) | Display filter (after capture) |
|---|---|---|
| Traffic to one machine | host 192.168.1.10 | ip.addr == 192.168.1.10 |
| Web traffic | port 80 | tcp.port == 80 |
| Everything except SSH | not port 22 | !(tcp.port == 22) |
| DNS to a resolver | udp port 53 | dns && ip.dst == 192.168.1.1 |
The Display Filter bar sits directly under the menu bar, and the toolbar button above it applies what you typed. A valid expression turns the bar’s right edge green, and an invalid one turns it red, which is the fastest way to know Wireshark cannot parse your expression.
These are the display filters worth memorising first:
| Purpose | Display filter |
|---|---|
| Only HTTP | http |
| Only DNS | dns |
| Only ping traffic | icmp |
| Address resolution | arp |
| One IP address, either direction | ip.addr == 192.168.1.1 |
| Traffic sent by a host | ip.src == 192.168.1.10 |
| Traffic sent to a host | ip.dst == 192.168.1.10 |
| One TCP port | tcp.port == 443 |
| One UDP port | udp.port == 53 |
| Both TCP and UDP on a port | port == 443 |
| Failed web responses | http.response.code >= 400 |
| Server errors only | http.response.code == 404 || http.response.code == 500 |
| A specific site lookup | dns.qry.name == “example.com” |
| Retransmitted segments | tcp.analysis.retransmission |
| Connection resets | tcp.flags.reset == 1 |
| Opening handshakes | tcp.flags.syn == 1 && tcp.flags.ack == 0 |
| TLS handshakes | tls.handshake |
| Combined conditions | dns && ip.addr == 192.168.1.1 && !arp |
| Text inside the packet bytes | frame contains “login” |
A capture filter belongs in the Capture button dialog, the field marked beside the interface you select. Setting host 192.168.1.10 there before you click the shark fin keeps a chatty machine from filling your capture with thousands of unrelated rows, which matters when you plan to read the file later.
7. Save, Export, and Troubleshoot
Use File, then Capture File, then Save to write the capture in the standard pcap or pcapng format. Those files open in Wireshark, tcpdump, and most security tools, so keep them rather than pasting screenshots. To keep only the rows a filter matched, apply the display filter first, choose File, then Export Specified Packets, and confirm the filtered selection.
Two statistics views pay off quickly. Statistics, then Conversations lists which IP pair exchanged the most bytes, which finds the top talker on a busy segment. Statistics, then Protocol Hierarchy shows the proportion of traffic by protocol, and is the fastest answer to what is actually using the network.
When a capture comes back empty or unreadable, work through these in order. On Windows, reinstall and accept Npcap. On Linux, log out and back in after joining the wireshark group, and check that dumpcap runs from your terminal. On macOS, confirm ChmodBPF is approved in Privacy & Security. Then pick the interface with live activity on its graph, avoid virtual adapters, keep promiscuous mode on by default rather than expecting it to reveal other machines’ traffic, and remember that HTTPS payloads stay encrypted, so an empty-looking TLS record is normal, not a fault.
For practice without touching anything live, wireshark.org publishes sample capture files covering everything from DNS failures to malware traffic, and beginner virtual labs pair a deliberately misconfigured service with a capture of what went wrong.
Common Mistakes
Capturing on the wrong interface is the most frequent problem, usually caused by picking the first row in the list instead of the one whose activity graph is moving. Choose the graph, not the position.
Skipping the Windows capture driver produces an app that opens cleanly and shows no interfaces at all, so rerun the installer and accept Npcap before debugging anything else. On Linux the same symptom usually means the wireshark group change has not taken effect yet, which one logout fixes.
Mixing up the two filter languages wastes more time than any other beginner error. port 80 is a capture filter and tcp.port == 80 is a display filter, and typing either one in the wrong box produces an error or silence.
Expecting to see other devices’ traffic on a switched network is a false alarm rather than a fault, since the switch forwards frames only to their destination. Capturing traffic between other machines needs port mirroring on the switch or a capture on the device itself.
Reading an encrypted payload as if it were plain text wastes an afternoon. TLS and HTTPS content is encrypted, so you can see addresses, ports, timing, and certificate details, but not the body of the request unless you hold the session keys.
Applying a filter, seeing one row, and assuming the network sent one packet is the last one. Filters hide packets rather than remove them, so clear the Display Filter bar to bring the whole capture back.
Frequently Asked Questions
Do I need administrator rights to use Wireshark?
Usually, yes. Reading raw packets requires elevated permissions, so Windows wants Npcap installed and often needs Wireshark launched as Administrator when interfaces are missing. On Linux, add your user to the wireshark group and log out and back in. On macOS, approve ChmodBPF under Privacy and Security. Running with sudo works but is a blunt fix.
Which network interface should I capture on?
Pick the interface carrying your own traffic, identified by the live activity graph beside its name rather than by its position in the list. On Wi-Fi that is the wireless adapter, on a wired desk setup it is the Ethernet port, and for a local server it is the loopback adapter. Virtual adapters from VMware, VirtualBox, Docker, or VPNs sit in the same list and usually show no activity.
What is the difference between a capture filter and a display filter?
A capture filter runs before recording and uses Berkeley Packet Filter syntax, deciding what is written to disk at all: host 192.168.1.10 or port 80. A display filter runs after recording against a file you already have, using a richer expression language: ip.addr == 192.168.1.10 or tcp.port == 80. Capture filters keep files small; display filters let you explore one capture many ways.
Can Wireshark decrypt HTTPS traffic?
Not on its own. Wireshark shows you the TLS handshake, the server certificate, the addresses, and the timing, but the payload stays encrypted. Decryption becomes possible when you hold the session keys, which browsers let you export for tools like SSLKEYLOGFILE, and you then load those keys in Wireshark preferences. Without keys, the encrypted bytes are all you get.
Is it legal to capture traffic on my home network?
Capturing on a network you own or administer is fine, and that covers your laptop, your router, and a home lab you built. It becomes a different matter on a network belonging to someone else, including a workplace, a café, or a shared Wi-Fi network you are merely connected to, where interception can count as wiretapping. When in doubt, ask whoever administers the network and get permission in writing.
Conclusion
Start with one small job: capture ten seconds of your own browsing, stop, and type dns into the Display Filter bar. Seeing a handful of query and response pairs teaches the workflow faster than any amount of reading.
Two ideas carry you through everything else. A capture filter decides what gets recorded and uses BPF syntax such as port 53, while a display filter decides what you look at afterwards and uses expressions such as ip.addr == 192.168.1.1. Keep those apart and Wireshark stops being confusing.
Then practise on something harmless: a local virtual machine, a home lab, or one of the published sample captures from the Wireshark site. Repeating the same steps on a few different files builds the reading speed no tutorial can hand you.