To find out why a website is slow, you bisect it: confirm the problem is real, rule out your own machine, take a baseline measurement, read the network waterfall in browser developer tools, then block one request at a time until the page speeds up. A slow server and a 4 MB hero image look identical from the outside and need completely different fixes, so measuring first is not optional. The whole sequence below takes about 30 minutes.
I have spent more time than I would like to admit chasing the wrong bottleneck. A site felt like it was drowning under its own database, and it turned out to be a 40-second analytics script that nobody owned. Diagnose before you optimize — every hour spent compressing images on a page with a two-second server response is an hour thrown away.
Table of Contents
- What You Need
- Step-by-Step: How to Find Out Why a Website Is Slow
- 1. Confirm the slowdown and identify which pages are affected
- 2. Measure the page with browser developer tools
- 3. Separate network time from rendering and script time
- 4. Test the page with Lighthouse or PageSpeed Insights
- 5. Check the server and backend response time
- 6. Check third-party scripts, fonts, and embedded content
- 7. Reproduce the problem under real user conditions
- Common Mistakes
- Frequently Asked Questions
- What is the fastest way to find out why a website is slow?
- Is a low Lighthouse score always the reason a website feels slow?
- How can I tell whether a website is slow because of the server or my internet connection?
- What does a long yellow bar in Chrome DevTools mean?
- Should I test website performance while logged in or logged out?
- How do I find third-party scripts that slow down a website?
- Conclusion
What You Need
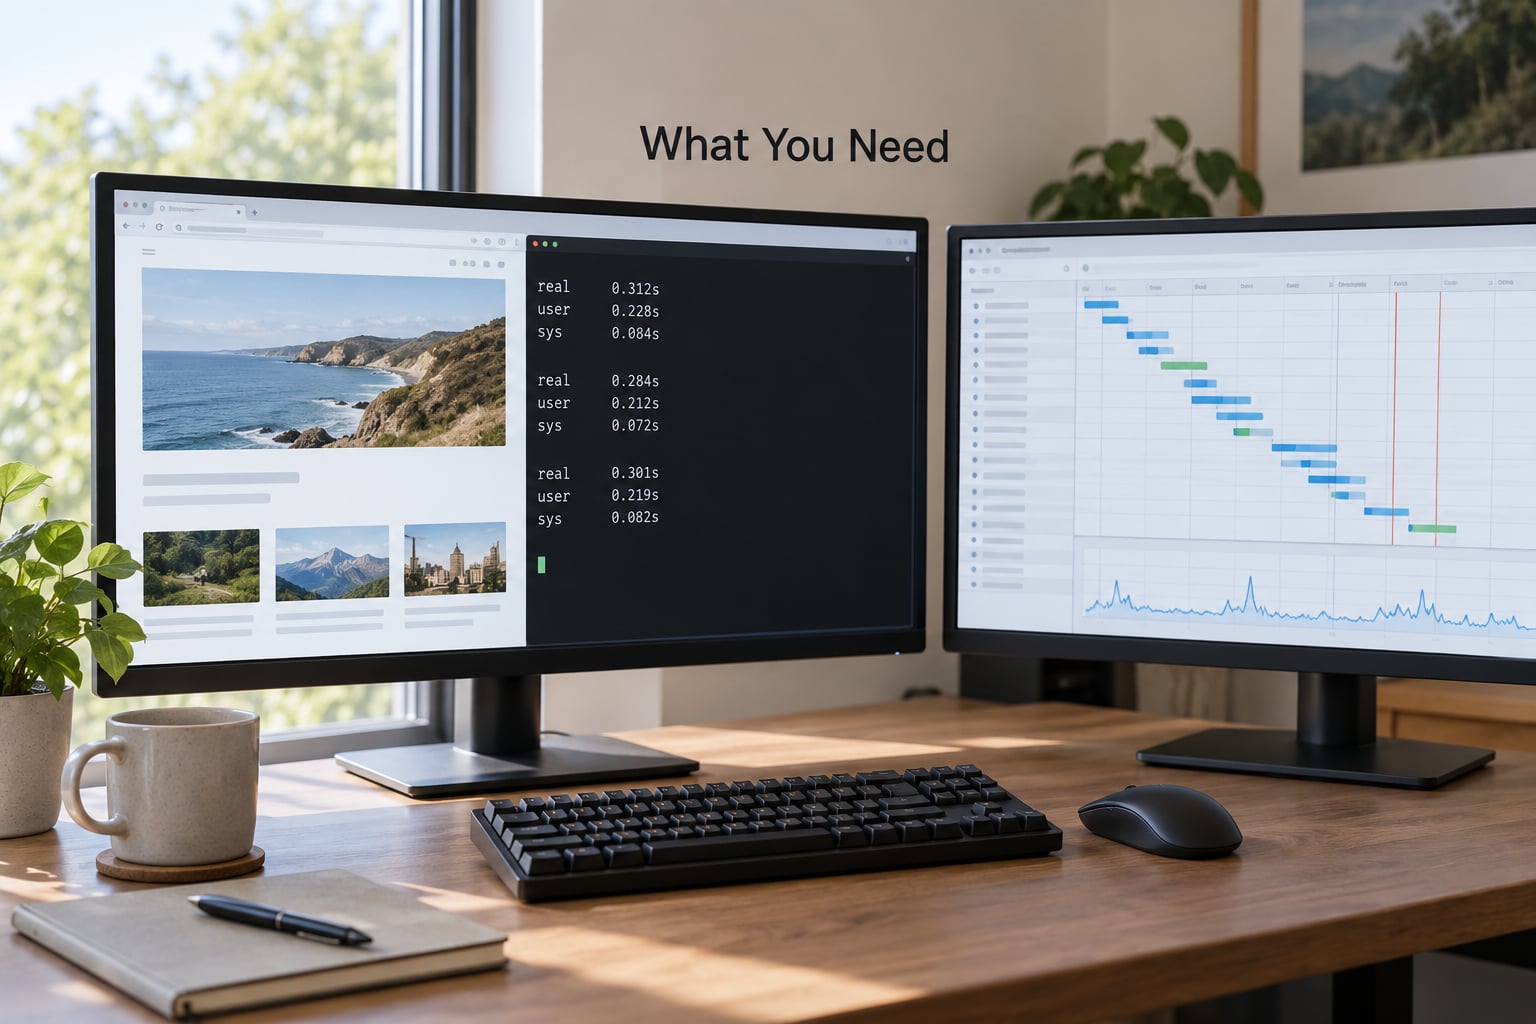
You need four things, and three of them are free and already installed.
- Access to the site. Ideally a hosting control panel or SSH, but you can get through steps 1 to 4 with nothing but a browser and the URL.
- Chrome, Edge, or Firefox developer tools. Press F12 on Windows and Linux, Cmd+Option+I on macOS, or right-click any element and choose Inspect.
- A speed test baseline. Google PageSpeed Insights is the fastest starting point; WebPageTest lets you pick a server location.
- Server access. Log access, a database console, or at minimum the ability to read response headers. Only needed for step 5.
- A second network. A phone on mobile data is ideal. It is the cheapest way to prove whether the slowness lives in your connection.
Two conditions make any measurement worthless, so set them before you start. Turn the browser cache off in the Network panel so you measure the same thing twice, and record the conditions in which you tested — device, browser, connection, and roughly what time it was. An unlabeled measurement turns into an argument three days later.
Step-by-Step: How to Find Out Why a Website Is Slow
1. Confirm the slowdown and identify which pages are affected
The first question is not which tool is slow, it is whether the site is slow at all. Open the affected URL in an incognito or private window and load it a few times. Then open it in a second browser and on a second device.
Three results, three different diagnoses. If the page is slow everywhere, the cause is on the server or the site itself. If it is fast everywhere except your usual browser, the cause is an extension, a proxy, or your DNS. If it is slow on one phone only, you are looking at page weight and render-blocking resources.
Classify the pattern before you touch a tool, because it narrows the search immediately.
| Symptom | Likely cause | Where to read it |
|---|---|---|
| Slow for every visitor, every page | Server capacity or slow backend code | TTFB in the Network panel, server logs |
| Slow only for you | Extensions, VPN, proxy, or DNS resolver | Incognito window, second network |
| Slow only on phones | Page weight, unoptimized images, main-thread work | Device toolbar plus CPU throttling |
| One page slow, rest of site fine | That page’s assets, embeds, or a slow query | Network panel filtered to that URL |
| First visit slow, repeat visits fast | Missing or short cache headers | Status column and Cache-Control header |
| Slow right after a plugin or theme update | New code path, a failed asset, a hung script | Console tab errors, git or changelog |
| Page loads, then freezes and drops frames | Long tasks, JavaScript execution, memory growth | Performance panel, Task Manager |
| Slow for visitors in one country only | Blocked or unreachable third-party asset | Waterfall pending bars, regional tests |
Note the last row. A stylesheet or font hosted on a public CDN that is unreachable from one country will hang the page for every visitor there while your own tests look perfect. The record I trust most from this exact pattern involved a single third-party asset timing out, and it was only visible once someone tested from outside Europe.
2. Measure the page with browser developer tools
Open developer tools and go to the Network panel. Tick Disable cache, then reload. Every request the page makes appears as a row, and hovering a row shows a breakdown of its phases.
Read the request list from left to right and only four columns matter at this stage. Name tells you what the file is, Status tells you whether it arrived, Time tells you how long the whole thing took, and Size tells you how heavy it was. Sort by Time with a single click and the worst offender jumps to the top.
Two things stand out before you go deeper. Requests sitting in a pale state with no result were cancelled or never finished. Requests marked from memory cache or disk cache are free, because your browser already had them.
3. Separate network time from rendering and script time
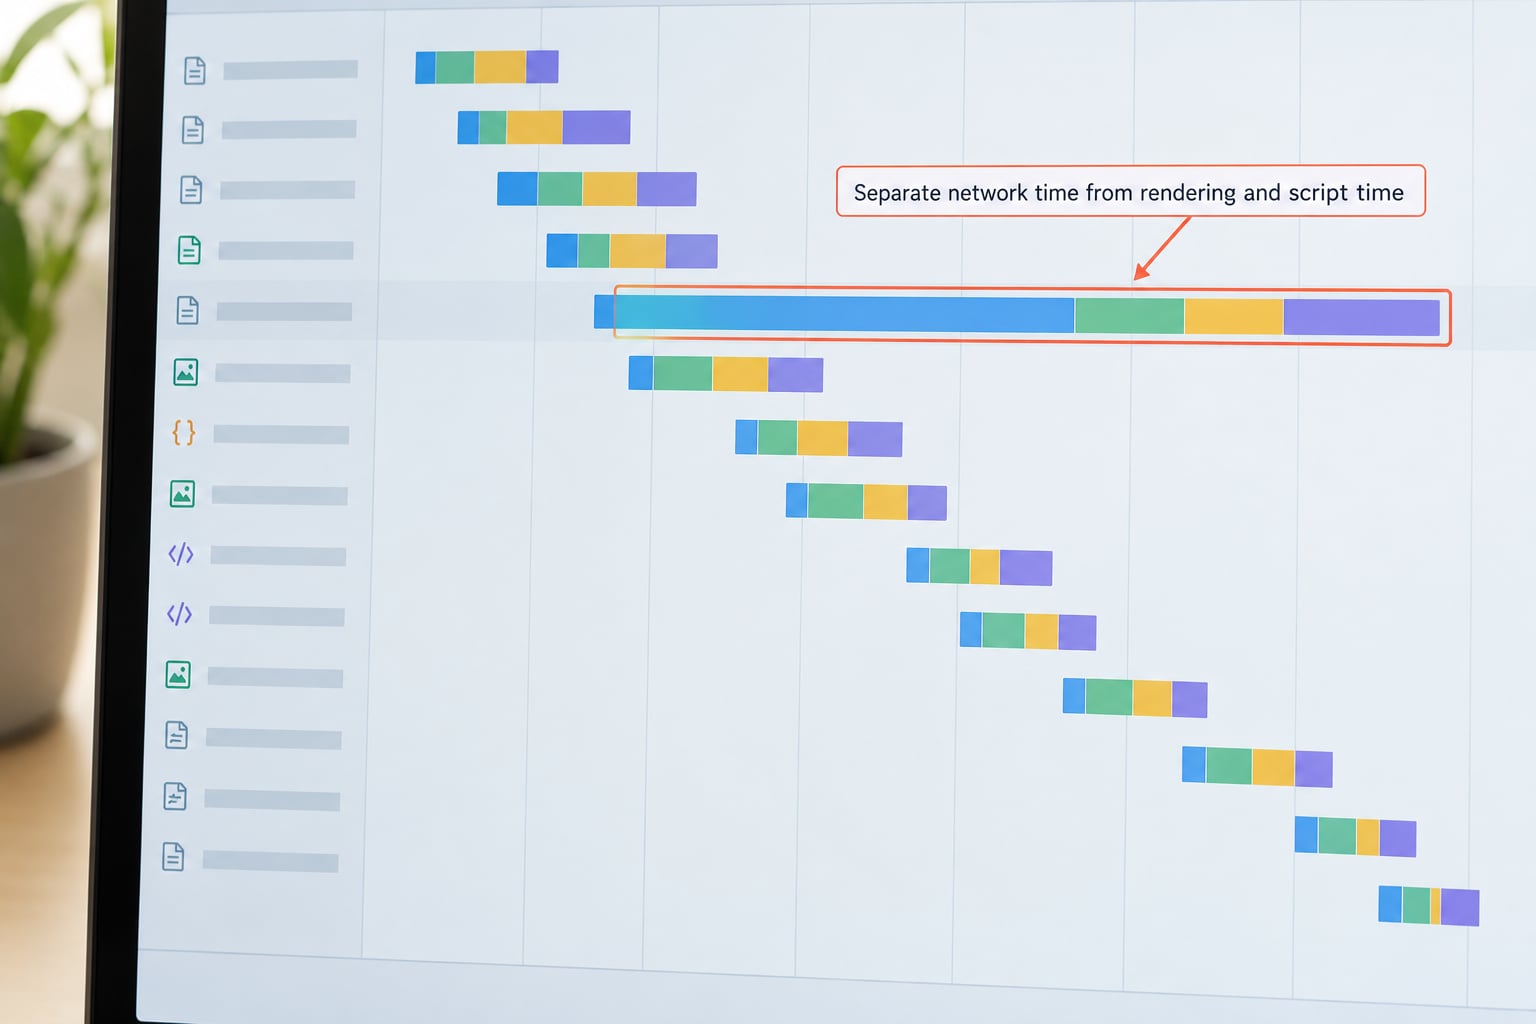
Each bar in the waterfall splits into phases, and a long bar in one phase points to a completely different fix than a long bar in another. This is the part almost every blog skips, and it is the part that tells you who to blame.
| Phase | What it measures | A long bar here means |
|---|---|---|
| Stalled | Browser throttling, proxy delay | Usually a simulation setting, not a real problem |
| DNS lookup | Resolving the hostname | Slow resolver, or a lookup for a domain that has no cache |
| Initial connection | TCP handshake | Server is far away, or the connection is not reused |
| SSL | TLS handshake | Server is missing HTTP/2 or HTTP/3, so handshakes repeat |
| Waiting (TTFB) | Server thinking | Your backend is slow — queries, PHP, cache misses |
| Content download | Bytes arriving | Oversized image, font, or JavaScript bundle |
The rule I work by is simple. A fat Waiting bar is your server. A fat download bar is your files. A bar that never resolves at all is someone else’s server. Once you know which shape your slowness has, you know which of the next three steps matters.
Network timing only covers the first part of the story, though. Switch to the Performance panel, record a load, and look at the long tasks along the main thread. A page can have a perfect waterfall and still take four seconds to become usable if a 900 ms script parse sits in the middle of it.
4. Test the page with Lighthouse or PageSpeed Insights
Paste the URL into PageSpeed Insights and it runs Lighthouse for you and shows both sets of numbers. The field data at the top comes from real Chrome users, the lab score underneath is a simulated run on a throttled connection.
Start in the Diagnostics section, not Opportunities. Opportunities tells you what could be better, diagnostics tells you what is actually broken, and that ordering is the difference between a fix and a guess.
Three findings in diagnostics are worth chasing early: a long main-thread task list, third-party code that adds significant time to total blocking, and a request count high enough to saturate a connection. Each one tells you where to point the next 20 minutes.
A low score is not a diagnosis. Lighthouse weights simulated conditions on a fixed device and a fixed network, so a site can score badly while real visitors see instant pages, or score fine while your slowest region suffers. Use the score to find candidates, not to end the investigation.
5. Check the server and backend response time
Server-side problems have a signature: a long Waiting phase on the main document, before a single byte of your assets is requested. Time to first byte is the number to read, and it is available in the Network panel’s Timing section or from the command line.
Run a plain timing test a few times and compare. A first response that varies wildly between runs points at cache misses or a database that occasionally struggles; a consistently slow response points at the hosting itself.
Then split “slow server” into two very different problems. Capacity means the box is saturated — CPU pinned, memory exhausted, too many concurrent requests. Application logic means the server is idle and the code is slow. On shared hosting you often get the first without any access to the metrics; on a VPS you can watch the load average and see the truth.
From here, look at what the server is actually doing. Query logs reveal a page firing hundreds of database queries for content that should be cached. On WordPress sites the usual suspects are unindexed tables, accumulated post revisions, and a stack of plugins each adding their own queries. Check whether compression is on too — responses without gzip or Brotli are noticeably heavier on slow connections.
One more header check here. Open the response headers for the document and look at Cache-Control and the caching of static assets. A page served with no cache policy at all will be slow on every single first visit, which is exactly the symptom people mistake for a server problem.
6. Check third-party scripts, fonts, and embedded content
Third-party code is where I have found the most embarrassing bottlenecks. Analytics scripts, tag managers, ad tags, chat widgets, heat-mapping tools, and social embeds all run on your visitors’ main thread, and none of them are covered by your hosting budget.
Find them in the waterfall by sorting on Time and scanning the Domain column for anything that is not your own domain or your CDN. A tag manager is easy to miss once it has loaded a dozen vendors from its own container.
Now isolate the culprit instead of guessing. Right-click the suspect request and choose Block request URL, then hard reload with Ctrl+F5. Compare the result to the previous run, then unblock it and confirm the slowness returns. That A/B pair is proof, and it takes under a minute per candidate.
The same method works for a single region. If tests from one location show requests that stay pending until they time out, and tests from elsewhere do not, you have found an asset that is blocked or unreachable from that country. Self-host the font or the stylesheet and the problem disappears.
7. Reproduce the problem under real user conditions
A trace from your laptop on office fibre tells you very little about a visitor on a cheap Android phone on a crowded mobile network. The DevTools device toolbar exists to close that gap.
Open the device toolbar and pick a mid-range phone rather than the newest flagship. Then set throttling to Slow 4G or Slow 3G and apply CPU throttling at 4x. Reload and watch what falls over first. On most content sites the answer is the hero image and the render-blocking stylesheet; on dashboards it is usually a large JavaScript bundle.
Compare a cold visit against a warm one. If the second load is dramatically faster, caching is doing its job and the real complaint is first-visit performance. If both are slow, caching is not the lever and you should stop looking at it.
Finish with field data. PageSpeed Insights shows Chrome UX Report figures when enough real users have visited, and a free web-vitals library on your own pages records what your visitors actually experience. When lab and field disagree, field wins — it is the only number that describes a real person waiting.
Common Mistakes
Treating one score as the verdict. A Lighthouse performance score compresses dozens of measurements into a single figure that changes with the machine it runs on. Read the diagnostics items, then confirm with field data.
Testing only on localhost. A local copy skips DNS, TLS, the CDN, the real network, and often the real server. It can look perfect while production drags. Always capture at least one trace against the live URL.
Measuring with a warm cache and blaming the site. A repeat visit from the same browser proves very little about a first-time visitor. Tick Disable cache and compare both states deliberately.
Changing five things before re-measuring. Turning on three plugins at once and seeing an improvement tells you nothing about which one did it. One change, one trace.
Reading a high load average as proof of a code problem. High load can just mean traffic exceeded what you are paying for. Compare CPU time per request before concluding that your code is at fault.
Optimizing before isolating. Compressing images will not help a page whose Waiting phase is two seconds. Diagnose the phase first, then fix what that phase points at.
Ignoring the network path. Before blaming a site, confirm you are not dealing with a slow DNS resolver or a saturated connection. Switching resolvers and retesting on mobile data costs five minutes and has solved more than one false alarm.
Frequently Asked Questions
What is the fastest way to find out why a website is slow?
Confirm it is not your machine first: load the page in an incognito window, on another device, and on another network. Then open the Network panel in Chrome or Firefox with Disable cache ticked, reload, and sort by Time. The longest bar tells you where to start. Finish with a Lighthouse run and block the top suspect to confirm it.
Is a low Lighthouse score always the reason a website feels slow?
No. Lighthouse simulates one device on one connection, so its score can be low on a site real visitors find quick, or high on a site that is painful in one country. Use the score to surface candidates in the Diagnostics section, then confirm with field data from real Chrome users before deciding what to fix.
How can I tell whether a website is slow because of the server or my internet connection?
Load the page on mobile data from another device. If it is fast there, your connection or resolver is the problem. If it is slow everywhere, look at the Waiting phase in the Network panel: a long time to first byte on a document request is the server, while a long download phase on a large file is your own page weight.
What does a long yellow bar in Chrome DevTools mean?
The bar shows how long a request waited for the server to send the first byte, plus the connection setup before it. A long yellow stretch usually means a slow response or a weak connection rather than a large file. Check the Timing section of that request, then compare it with the Content download phase to see whether your server or your file size is at fault.
Should I test website performance while logged in or logged out?
Test both, because they are different pages. Logged-in pages usually carry a heavier menu, account data, and personalization scripts, and are often the slowest screens on a site. A logged-out load establishes your baseline; the logged-in trace then shows exactly what the extra weight costs the people who matter most.
How do I find third-party scripts that slow down a website?
Open the Network panel, reload, and sort by Time. Scan the Domain column for anything that is not your own site or your CDN, which surfaces analytics, tag managers, chat widgets, and ad tags. To confirm one, right-click its request, choose Block request URL, hard reload with Ctrl+F5, then unblock and reload again to confirm the slowness returns.
Conclusion
Start with one trace. Reproduce the slow page in an incognito window on a second network, open the Network panel with the cache disabled, and note which phase is long: Waiting means your server, download means your files, and a request that never finishes means someone else’s.
Then confirm it. Block the single worst request, reload, and check whether the page recovers; if it does, you have your cause with evidence rather than a hunch. Every performance project that stalls out does so at the second stage, when someone starts optimizing before they know which layer is broken.
Once the culprit is named, the fixes are boring and well known: smaller images, lazy loading, caching headers, a CDN, fewer plugins, fewer tags. Pick the one that matches your slowest phase. As of 2026, that is still the shortest route to a fast site.