GDB, the GNU Debugger, is a free command-line program that runs your program on your behalf, stops it at a breakpoint you choose, and then shows you what every variable holds at that exact line. That is the whole idea: instead of guessing where a bug lives by adding print statements, you stop the program at a line and look. This guide walks through gdb basics for beginners using two small C programs you can compile and run yourself.
I am assuming a Linux or macOS terminal and a C program built with gcc or clang. Commands look the same on other setups, but exact output can differ slightly between GDB versions and platforms. Everything below was checked against a current GDB release in October 2026.
Table of Contents
- What Is GDB and Why Should Beginners Use It?
- How Do You Compile a Program for GDB?
- How Do You Set and Manage Breakpoints?
- How Do You Step Through Code and Inspect Variables?
- Printing values in different formats
- Arrays, structs, and pointers
- How Do You Examine Memory and Debug Common Runtime Problems?
- Null pointers and invalid pointers
- When the program hangs instead of crashing
- How Do You Use GDB with a Core Dump?
- What Are the Most Useful Beginner GDB Workflows?
- Frequently Asked Questions
- Is GDB difficult to learn?
- How do I use GDB step-by-step?
- What are the basic GDB commands?
- Is GDB for C or C++?
- Why does GDB say there are no debugging symbols?
- Conclusion
What Is GDB and Why Should Beginners Use It?
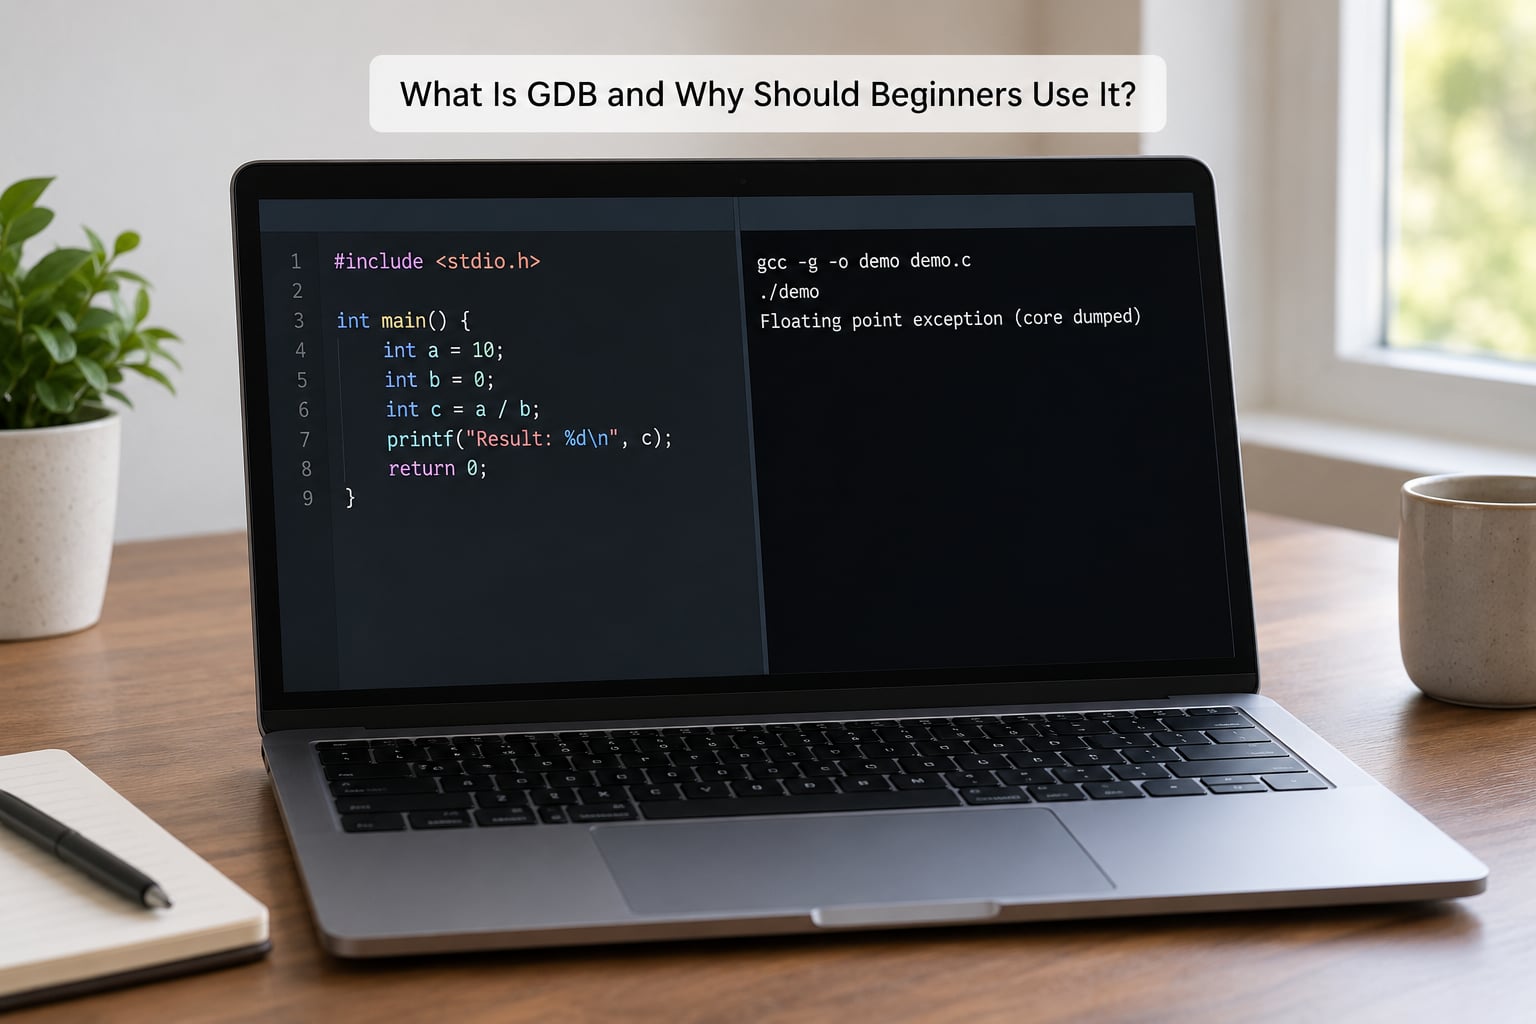
GDB does not fix your code. It shows you the state of your program at a moment you choose, which turns a search through guesswork into a search through evidence. A crash that takes twenty print statements to localise usually takes two commands to localise in GDB.
It helps to separate three things people lump together as debugging:
- Compile errors come from the compiler before your program ever runs. No executable exists yet, so no debugger can help.
- Logic errors mean the program runs to completion but produces the wrong answer. GDB lets you stop mid-run and compare values against what you expected.
- Runtime errors include segmentation faults, infinite loops, and use of uninitialised memory. GDB shows you the call stack at the moment things went wrong.
GDB works on compiled code. It is strongest with C and C++, and it also handles Rust, Go, Ada, D, and other languages that produce native binaries with symbol information. For C++ it relies on pretty printers to render containers such as std::vector in a readable way, which is where the out-of-the-box experience is weakest.
The most common beginner complaint is that GDB has hundreds of commands. It does, and you should ignore nearly all of them. Roughly twelve commands cover the overwhelming majority of real debugging sessions, and these gdb basics for beginners are built around those twelve.
How Do You Compile a Program for GDB?
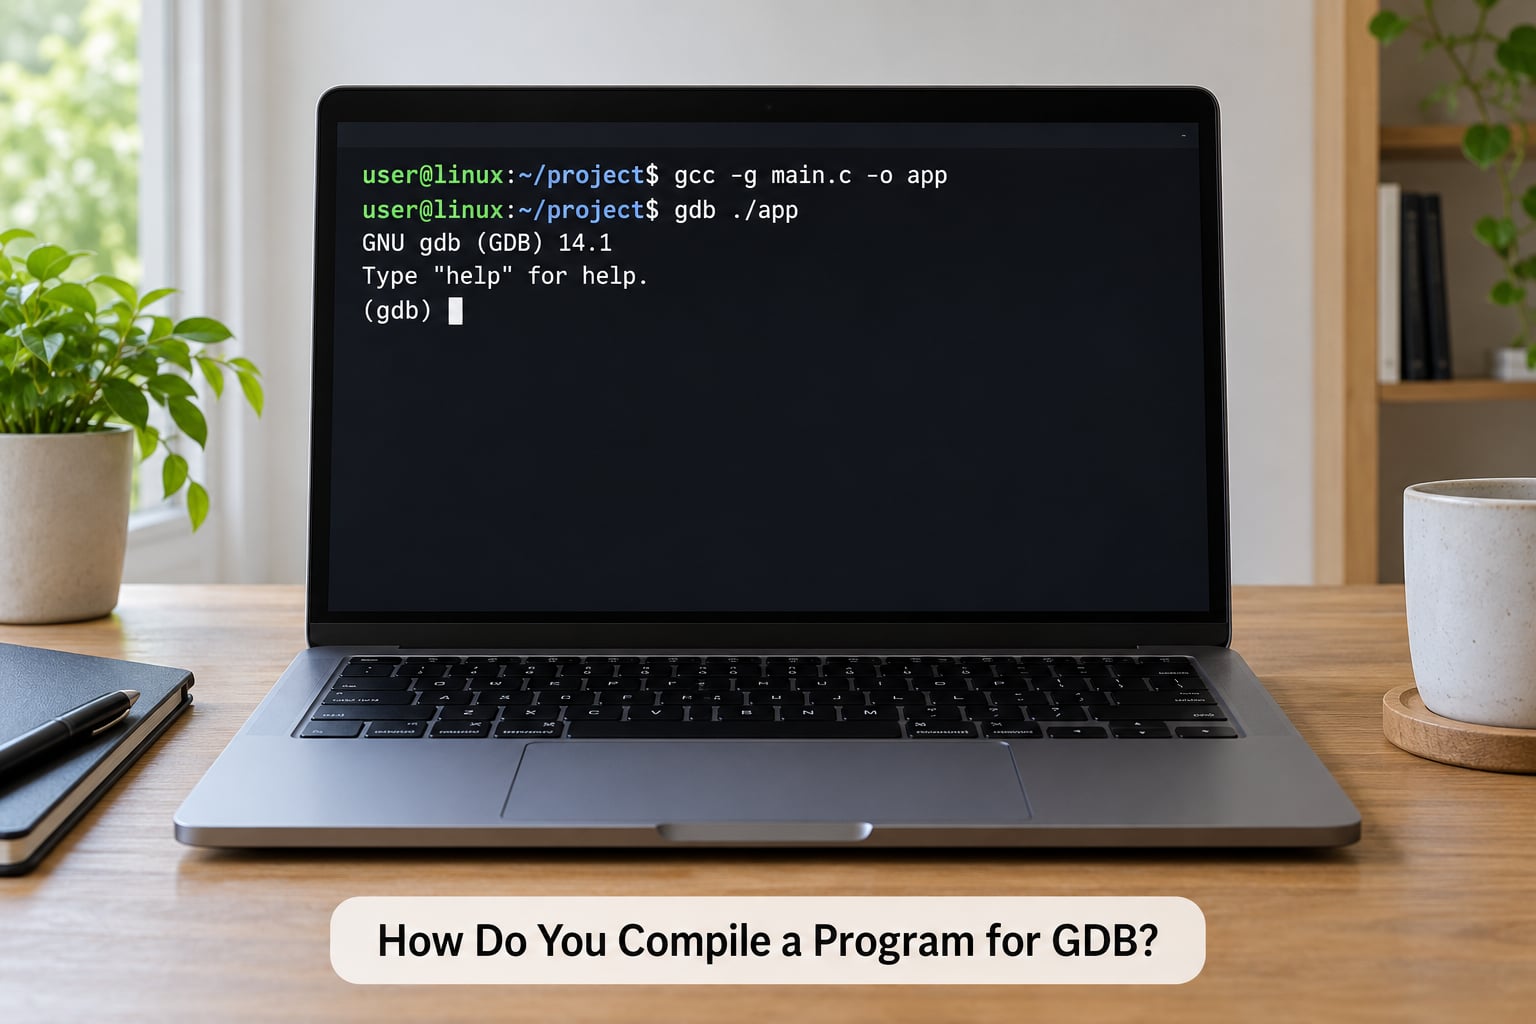
Compile with the -g flag before anything else. Without it, your executable carries no line numbers, function names, or variable names, and GDB will tell you so.
gcc -g -Og avg.c -o avg
gdb ./avg
-g embeds debugging symbols, normally in DWARF format, so the linker can map any machine address back to a source file and line. -Og is a mild optimisation level that keeps variables readable while still speeding the program up slightly. Beginners can skip -Og entirely; what matters is -g.
Now build this deliberately broken program. The loop should run nine times but runs ten.
#include <stdio.h>

int main(void) {
    int total = 0;
    int count = 0;

    for (int i = 1; i <= 10; i++) {
        total += i;
        count++;
    }

    printf("count=%d total=%dn", count, total);
    return 0;
}
The expected output is count=9 total=45. What you actually get is count=10 total=55. Compile it with symbols, launch GDB, and quit out.
$ gcc -g -Og avg.c -o avg
$ gdb ./avg
GNU gdb (Ubuntu 15.1) 15.1
Copyright (C) 2026 Free Software Foundation, Inc.
Reading symbols from avg...
Reading symbols from avg...
(gdb) quit
The (gdb) prompt is where every command is typed. Here is the short command reference you will use most:
| Command | Abbreviation | What it does |
|---|---|---|
gcc -g prog.c -o prog | Compile with debugging symbols | |
gdb ./prog | Launch GDB on an executable | |
run | r | Start the program, taking the first breakpoint |
list | l | Show source lines around the current line |
break line | b | Set a breakpoint |
next | n | Run the next line, stepping over function calls |
step | s | Run the next line, stepping into function calls |
print expr | p | Print the value of an expression |
backtrace | bt | Show the call stack |
quit | q | Leave GDB |
How Do You Set and Manage Breakpoints?
A breakpoint is a marker that tells GDB to pause the program when execution reaches a particular source line or enters a particular function. Setting one by function name is usually more durable than setting it by line number, because line numbers move when you edit the file.
(gdb) break main
Breakpoint 1 at 0x1159: file avg.c, line 3.
(gdb) break avg.c:8
Breakpoint 2 at 0x1163: file avg.c, line 8.
(gdb) run
Starting program: /home/you/avg

Breakpoint 1, main () at avg.c:3
3       int main(void) {
GDB confirms every breakpoint with its number, address, file, and line. That confirmation line is the fastest way to know your breakpoint was placed where you thought, and it is the first habit worth building.
Other forms worth knowing:
break avg.c:12sets a breakpoint on a specific line.tbreak avg.c:12sets a temporary breakpoint that deletes itself after it fires once, which is handy inside a loop that runs hundreds of times.break avg.c:10 if i == 7sets a conditional breakpoint. GDB evaluates the condition each time it reaches the line and only stops when the condition is true. This is the practical way to reach iteration 500 of a long loop.info breakpointslists every breakpoint with its hit count.delete 2removes breakpoint 2;deletewith no argument removes all of them.disable 2andenable 2turn one off and back on without deleting it.
Two things surprise almost everyone at first. Breakpoints never fire, or execution lands somewhere strange.
If breakpoints never fire, check the message from info breakpoints. A line shown as breakpoint already pending means GDB has not found the file or function yet, often because of a search path. A breakpoint with a pending status also shows up when the program has not run far enough to load shared libraries that define the function.
If GDB says No debugging symbols found, the binary was compiled without -g. Recompile with the flag and relaunch.
If you get Breakpoint 1, 0x00007ffff7a0c1e0 in printf () from file /build/glibc..., you pressed step at a line calling printf and stepped into the C library. The library was compiled without symbols, so GDB cannot show you its source. Nothing is broken. Press finish to run to the end of printf, or until 12 to stop at a specific line in your own file instead.
How Do You Step Through Code and Inspect Variables?
Once stopped at a breakpoint, you control execution line by line. These are the four commands that matter in gdb basics for beginners, and when each one is the right choice:
| Command | What it does | Use it when |
|---|---|---|
next (n) | Runs the next source line and stops; calls to functions run to completion without entering them | By default, for almost everything |
step (s) | Runs the next source line and enters any function that line calls | You suspect the answer is inside a function |
continue (c) | Resumes normal execution until the next breakpoint or until the program ends | You have confirmed what you needed |
finish | Runs until the current function returns, then stops at the caller | You stepped into something you did not mean to |
The mental model is short: next steps over a call, step steps into it. The single most common beginner mistake is pressing step on a line calling printf and ending up lost inside the C standard library with no source to read.
(gdb) break avg.c:9
Breakpoint 1 at 0x1167: file avg.c, line 9.
(gdb) run
Breakpoint 1, main () at avg.c:9
9               total += i;
(gdb) print i
$1 = 7
(gdb) print total
$2 = 21
(gdb) next
10              count++;
(gdb) print count
$3 = 7
At this point the facts are in front of you: i is 7 and count is 7, so count equals i. The loop bound i <= 10 admits ten iterations, not nine. That conclusion comes from reading the code, not from GDB. GDB supplies the values, you supply the reasoning.
Printing values in different formats
Append a format letter to change how GDB renders a value:
(gdb) print/x i
$1 = 0x7
(gdb) print/d i
$2 = 7
(gdb) print (char)65
$3 = 65 'A'
/x gives hexadecimal, /d decimal, /u unsigned, /c character, /t two’s complement in binary, and /f a floating-point value. Hexadecimal matters when you are chasing pointers, because GDB prints addresses in hex by default.
Arrays, structs, and pointers
(gdb) print total
$1 = 21
(gdb) print arr@10
$2 = {1, 3, 6, 10, 15, 21, 28, 36, 45, 55}
(gdb) print *point
$3 = 7
(gdb) set var arr[4] = 99
(gdb) print arr[4]
$4 = 99
The name@count syntax prints a fixed number of elements from an array or pointer, which saves typing long expressions. For a struct, print the pointer with p *point or the object with p point, and you get every field at once. You can also reach a single field with print point->value.
Two commands give you a whole snapshot without naming anything: info locals prints every local variable in the current function, and info args prints that function’s arguments. info breakpoints, info registers, and info functions cover the rest of the usual cases.
When the file on screen is not the one you want, list avg.c:1,20 prints a line range, set directory ../src adds a search path, and directory src swaps to it.
How Do You Examine Memory and Debug Common Runtime Problems?
Printing variables answers most questions. Sometimes you need to see the raw bytes at an address, especially when a pointer is involved or a struct is not declared where you are looking. The x command, short for examine, dumps memory, and it is the piece of gdb basics for beginners that most guides skip. Its format is x/count/format address.
| Letter | Shows memory as |
|---|---|
x | Hexadecimal, grouped in 2-byte units |
d | Signed decimal |
u | Unsigned decimal |
t | Binary |
c | Characters |
s | A null-terminated string |
i | Instructions (disassembly) |
(gdb) print &total
$1 = (int *) 0x7ffe4c3b2a1c
(gdb) x/8xb &total
0x7ffe4c3b2a1c: 0x15 0x00 0x00 0x00 0x00 0x00 0x00 0x00
Read that carefully. The first four bytes are 15 00 00 00, which is 21 in decimal, matching total. The four zero bytes that follow belong to whatever the compiler placed next in memory, most likely count, which is still 0 because the loop body has not executed yet. Bytes past the end of a variable are not yours to rely on.
Null pointers and invalid pointers
Dereferencing a null pointer usually produces the same symptom: a segmentation fault report at runtime. Here is a program that does it on purpose.
#include <stdio.h>
#include <stdlib.h>

typedef struct {
    int width;
    int height;
} Size;

int area_of(Size *s) {
    return s->width * s->height;
}

int main(void) {
    Size *s = malloc(sizeof(Size));

    printf("%dn", area_of(s));
    free(s);
    return 0;
}
Nothing initialises the struct fields, so width and height hold whatever the allocator left behind. Run it under GDB and let it crash.
(gdb) break area_of
Breakpoint 1 at 0x1129: file area.c, line 9.
(gdb) run
Breakpoint 1, area_of (s=0x5555555592a0) at area.c:9
9       return s->width * s->height;
(gdb) print *s
$1 = {width = 32766, height = 22065}
(gdb) next
Program received signal SIGSEGV, Segmentation fault.
0x0000000000000000 in __GI___libc_free (area.c:11)
Now the interesting part. backtrace shows the call stack at the crash, and up and down move between frames.
(gdb) backtrace
#0  0x00007ffff7a0d2a0 in __GI___libc_free () from /lib/x86_64-linux-gnu/libc.so.6
#1  0x00005555555552c1 in main () at area.c:11
(gdb) frame 1
#1  0x00005555555552c1 in main () at area.c:11
11          free(s);
(gdb) info args
s = 0x5555555592a0
(gdb) print *s
$2 = {width = 32766, height = 22065}
(gdb) print s
$3 = (Size *) 0x5555555592a0
What you can observe is solid: s is a valid-looking heap address, the fields hold large garbage values, and the fault happened inside free, not inside area_of. What you conclude from that is a separate step. Two readings fit the evidence: malloc returned uninitialised memory and the struct was never filled in, or something overwrote the fields after allocation. To tell them apart, set a breakpoint on the line after malloc and print the fields again. If they are garbage there too, the struct was simply never initialised, and assigning s->width = 10 fixes the cause rather than the symptom.
Keep that habit in mind: GDB reports what is true at this instant. Deciding why is your job, and often the next breakpoint is what settles it.
When the program hangs instead of crashing
Press Ctrl+C to interrupt a running program. GDB stops wherever execution happened to be and a backtrace tells you which loop it is stuck in. If the frame shows main still inside your loop rather than inside a library call, your loop condition is usually the suspect. Print the loop variable and look at it.
How Do You Use GDB with a Core Dump?
A core dump is a file the operating system writes when a process dies from a signal such as SIGSEGV. It captures the process memory at that instant, so you can inspect the crash later, on a different machine, or after a restart, even though the live process is gone.
First, ask your shell whether core dumps are allowed at all:
$ ulimit -c
0
$ ulimit -c unlimited
A result of 0 means core files are disabled for this shell, which is the default on many systems. Set it to unlimited before running the program that crashes. The dump then appears in your working directory, or in the location named by /proc/sys/kernel/core_pattern on distributions that redirect dumps to a crash handler such as systemd-coredump or apport.
$ gcc -g -Og area.c -o area
$ ./area
Segmentation fault (core dumped)
$ ls
area  area.c  core
$ gdb ./area core
GNU gdb 15.1
Reading symbols from area...
[New Thread 0x7fff0a3c2740 (LWP 17240)]
Program terminated with signal SIGSEGV, Segmentation fault.
#0  0x00007ffff7a0d2a0 in __GI___libc_free (area.c:11)
From here the workflow is the same as any other crash. bt shows the stack, frame N selects a frame, info args and info locals show what that frame held, and list shows the source. You cannot step or continue, because the process is already gone.
Two things commonly prevent a useful dump: the program was compiled without -g, which leaves you with addresses and no variable names, and the system routes cores to a handler rather than your directory. Check both before assuming GDB is at fault.
What Are the Most Useful Beginner GDB Workflows?
Start from the symptom rather than from the command list. Match the problem, then work down the table.
| Symptom | First command | Then |
|---|---|---|
| Segmentation fault | bt | frame 1, then info args and print in the caller’s frame |
| Wrong value or wrong total | break near the assignment, print the variable | Step backwards through the arithmetic with next |
| Program hangs | Ctrl+C | bt to find the loop, then print its condition variable |
| Value changes with no obvious cause | watch variable | GDB stops at the exact line that writes it and shows the new value |
| Breakpoint not hit | info breakpoints | Check for pending status, then recompile with -g |
| Lost inside a library call | finish | Then list to get back to your own source |
A watchpoint is a data breakpoint: watch total stops execution the moment the value of total changes, and tells you which line changed it. rwatch total stops when it is read, and awatch total on both read and write. This is the fastest answer to “who modified this variable?” when the answer is not a line you would have thought to check.
Four repeatable sequences cover most sessions:
# Wrong value: stop near the maths
(gdb) break avg.c:9
(gdb) run
(gdb) print i
(gdb) next
(gdb) print total

# Crash: read the stack from the inside out
(gdb) run
(gdb) bt
(gdb) frame 1
(gdb) info args
(gdb) print *s

# Hang: interrupt, then find the loop
(gdb) run
^C
(gdb) bt
(gdb) frame 0
(gdb) info locals

# Something overwrites a variable: let GDB catch it
(gdb) break main
(gdb) run
(gdb) watch total
(gdb) continue
Before you edit any code, record four things: the exact line you stopped at, the value of every relevant variable, the backtrace if it crashed, and the output of the unmodified program. That is enough to reproduce the bug tomorrow, and it is the part people skip when they rush to change something.
Two habits speed up everything else. Pressing Enter repeats the last command, so next ten times is next followed by nine Enters. And GDB can rebuild your program while staying in the session: if you use make, the make command inside GDB recompiles and reloads the binary, so your breakpoints survive the rebuild.
Frequently Asked Questions
Is GDB difficult to learn?
The command syntax is the easy part. Only about twelve commands cover almost every real debugging session, and most beginners already understand what a breakpoint is the first time it stops their program. The real work is knowing when to step versus when to print, and that comes from practice on small programs. The concepts transfer too: once you understand breakpoints, stepping, and inspecting memory in GDB, switching to another debugger later takes minutes.
How do I use GDB step-by-step?
Compile your program with gcc -g -Og program.c -o program, then run gdb ./program. At the prompt, type break main and press run. Use next to advance one line, step when you need to enter a function, print variable_name to see a value, and continue to resume execution. Finish leaves a function you stepped into by mistake, and quit closes GDB. Those eight steps work on almost any small C program.
What are the basic GDB commands?
The core set is: run to start the program, break and its short form b to set breakpoints, next and step to control execution line by line, continue to resume, finish to leave a function, print and p to show values, backtrace and bt to see the call stack, up and down to move between stack frames, list to show source, info for status details, and quit to exit. Everything else in GDB builds on those.
Is GDB for C or C++?
GDB is not limited to one language. It debugs any program compiled to native code with symbol information, which includes C, C++, Rust, Go, Ada, and D. It works best with C, and C++ needs pretty printers to display containers such as std::vector and std::string in a readable way. If you are starting out in either language, the same commands work with no change.
Why does GDB say there are no debugging symbols?
That message means your executable was compiled without the -g flag, so GDB cannot map addresses to source lines or variable names. Recompile with gcc -g -Og program.c -o program, then launch GDB on the new binary. If the message persists, check that you are pointing GDB at the file you just rebuilt and that the compiler you used is the one producing the binary you are debugging.
Conclusion
All of gdb basics for beginners comes down to one loop: compile with gcc -g -Og program.c -o program, launch gdb ./program, set a breakpoint with break main, run, move with next, look at a value with print, and quit when you are done. If it crashes instead, bt and info args are your next two commands.
Do not try to memorise the command list. Practise on a small program you can reproduce every time, keep the two examples from this page handy, and the rest will follow. Once the loop feels natural on twenty lines of C, the same commands work on a codebase of twenty thousand.