
Valgrind basics for C programmers come down to two commands: compile your program with gcc -g -O0 prog.c -o prog, then run valgrind --leak-check=full --track-origins=yes ./prog. The first flag embeds source line numbers in the binary. The second makes Memcheck report every leak, invalid read and uninitialised value with a file and line you can jump straight to.
You do not change a single line of C to get those reports. Valgrind runs your existing binary and watches every memory access as it happens, which is exactly what a segmentation fault cannot tell you. The cost is time: expect roughly 20 to 100 times slower than a normal run, so you use it on small test cases rather than on your full workload.
This guide walks through installing the tool, reading a real report line by line, and fixing the four memory mistakes that hit almost every new C programmer. It is written for gcc and make, and every command is meant to be pasted straight into a terminal.
Table of Contents
- What You Need
- Step-by-Step: Run Your C Program Under Memcheck
- 1. Compile the C Program with Debug Symbols
- 2. Run Memcheck and Save the Report
- 3. Read the Error Kind and Trace Blocks
- 4. Reproduce and Fix the Error
- 5. Recheck with a Clean Build
- Understand the Most Common Valgrind Errors
- Invalid read and invalid write of size N
- Invalid free, double free and mismatched allocation
- Use of uninitialised values
- Memory leaks and the leak summary
- Valgrind Basics for C Programmers: Useful Options and Limits
- Common Mistakes
- Frequently Asked Questions
- How do I install Valgrind on Ubuntu?
- What does u0022definitely lostu0022 mean, and should I fix u0022still reachableu0022?
- Do I really need to compile with -g to use Valgrind?
- Why is Valgrind so much slower than running my program directly?
- What can Valgrind not find?
- Conclusion
What You Need
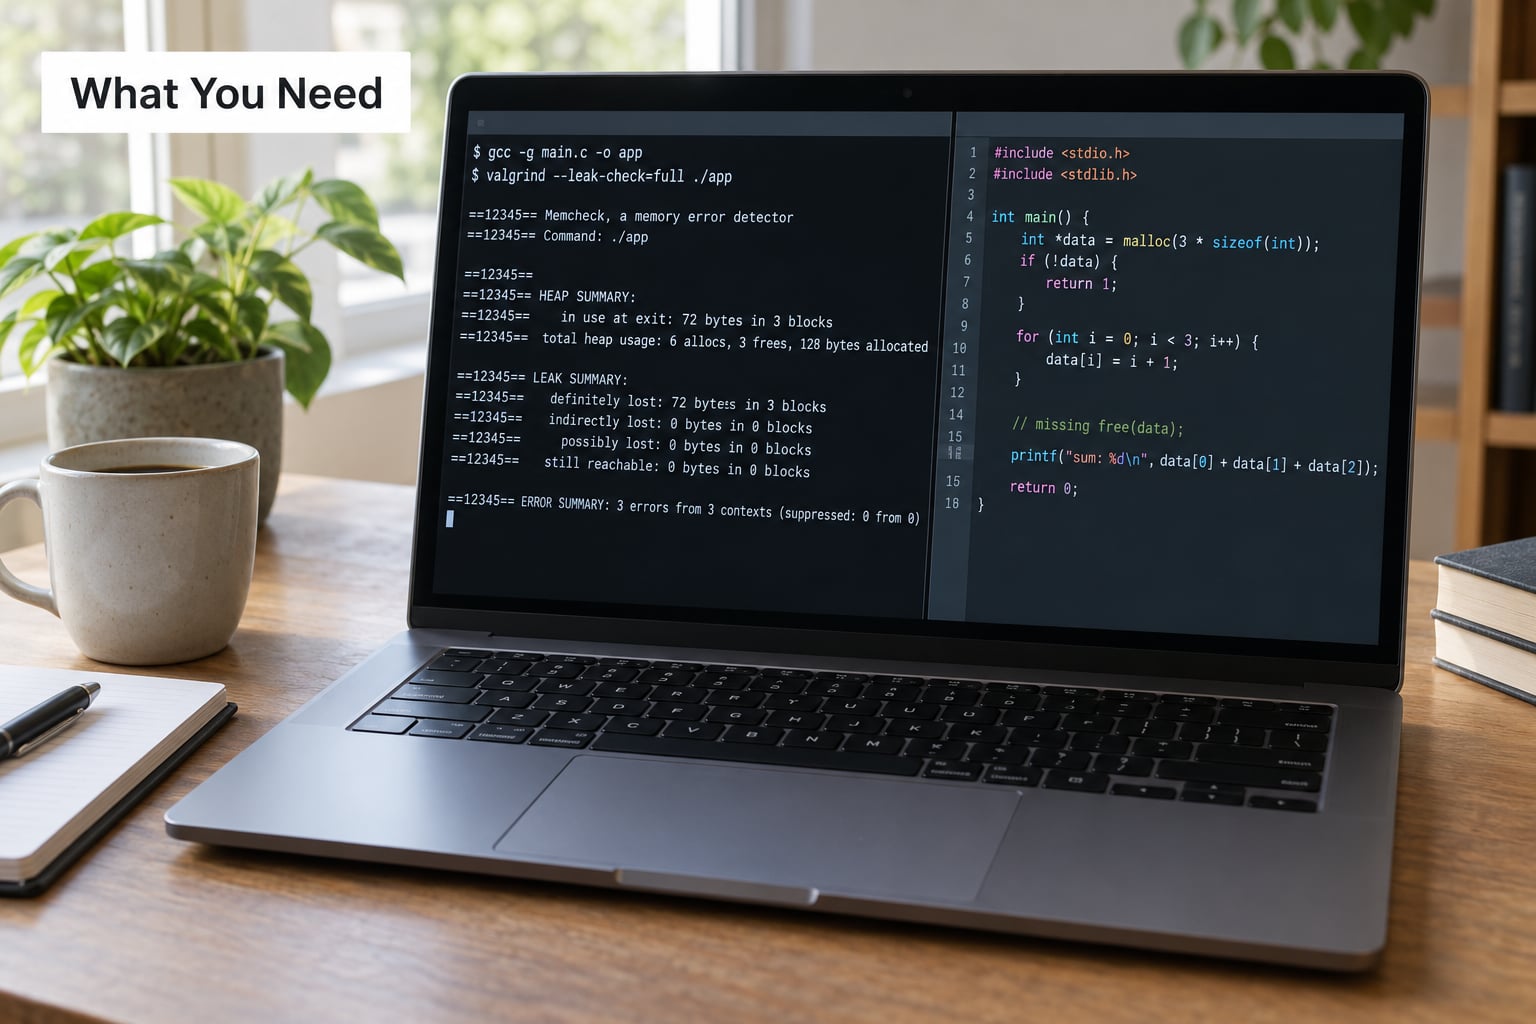
Valgrind is a dynamic instrumentation framework for Linux and macOS. It loads your compiled program, replaces the real CPU with a pseudo-CPU, and translates each machine instruction into an intermediate form that runs through a JIT translation cache. Memcheck, the tool you get by default, keeps extra bookkeeping bytes beside every block you allocate so it knows at runtime which memory is valid, which was freed, and which was never written.
That design is why you get line numbers, not just addresses. Memcheck can point at the exact free() you forgot, the exact array read that ran one element too far, and the exact branch that used a stack variable you never initialised.
You need three things:
- A C compiler. gcc and clang both work; the examples below use gcc.
- A terminal and make, if you want the build steps to be repeatable.
- Valgrind itself, plus its debug symbols matching your compiler version if your distribution splits them out.
Install it with the package manager for your system:
- Ubuntu or Debian:
sudo apt update && sudo apt install valgrind - Fedora, RHEL or Rocky:
sudo dnf install valgrind - Arch:
sudo pacman -S valgrind - macOS:
brew install valgrind - Windows: there is no native port, so use WSL2. Run
wsl --install -d Ubuntuin PowerShell, then install Valgrind inside that Linux with apt as above.
Check it landed with valgrind --version. A working installation prints a version number such as 3.22.0 and nothing else.
Now save a deliberately broken program as leakcheck.c. It contains one uninitialised read, one heap overflow, one out-of-bounds array read, one leak and one double free.
#include <stdio.h>
#include <stdlib.h>
#include <string.h>

int main(void)
{
    int total;                      /* 1. never initialised */
    if (total > 0) {
        printf("total: %dn", total);
    }

    char *buf = malloc(16);         /* 2. overflow below */
    strcpy(buf, "this string is far too long for the buffer");
    free(buf);

    int *nums = malloc(4 * sizeof *nums);
    for (int i = 0; i < 4; i++) {
        nums[i] = i * 2;
    }
    printf("fifth value: %dn", nums[4]);   /* 3. out of bounds */

    free(nums);                     /* 4. nums is never freed */
    free(nums);                     /* 5. double free */
    return 0;
}
Compile it and run it normally first. It may print a fifth value that looks plausible, or crash, or do neither. That is the point: the output of this program tells you almost nothing about whether the memory handling is correct.
Step-by-Step: Run Your C Program Under Memcheck
1. Compile the C Program with Debug Symbols
Build with -g and -O0, and skip the optimiser while you debug:
gcc -g -O0 -Wall -Wextra -std=c11 leakcheck.c -o leakcheck
-g adds debug information: function names, variable names, and the file and line each instruction came from. Memcheck uses that map to turn an address in a backtrace into leakcheck.c:22. Without it you get ??? in every frame, and the report is far less useful.
-O0 disables optimisation so the line numbers in the report match the lines you wrote. Inlining and aggressive optimisation shuffle code around, and the reported line can end up in a function you do not recognise. The -Wall and -Wextra flags are not required for Valgrind but will point out several of these bugs before you even start.
You can confirm the binary carries the information with file leakcheck, which should mention “with debug_info, not stripped”, or with readelf -S leakcheck | grep debug.
2. Run Memcheck and Save the Report
The short form is valgrind ./leakcheck. The version worth memorising, and the one I paste into a Makefile, is:
valgrind --tool=memcheck --leak-check=full --show-leak-kinds=all
        --track-origins=yes --error-exitcode=1 ./leakcheck
--leak-check=full adds the LEAK SUMMARY block at the end, which is off by default in recent versions. --track-origins=yes follows uninitialised values back to where they were created rather than only where they were used, which turns a vague warning into a fixable one. --error-exitcode=1 makes the process exit non-zero when errors exist, which is what lets a build or CI job fail automatically.
Your program’s own output goes to standard output and the Valgrind report goes to standard error. To keep both in one file, redirect stderr rather than stdout:
valgrind --leak-check=full --track-origins=yes ./leakcheck > run.log 2>&1
The 2>&1 at the end matters. Leave it out and you capture only the program’s prints and throw the report away, which is a frustrating way to lose ten minutes.
3. Read the Error Kind and Trace Blocks
Every error arrives in the same shape: a header naming the error, a block of source lines, and a stack trace. The first block your program produces looks roughly like this:
==12345== Conditional jump or move depends on uninitialised value(s)
==12345==    at 0x4006A2: main (leakcheck.c:11)
==12345==    by 0x1081B99: __libc_start_main (/lib/x86_64-linux-gnu/libc.so.6+...)
==12345==
==12345== Use --track-origins=yes to get backtraces where uninitialised
==12345== values come from. See the User Manual for details.
Read it in this order. The header line tells you the error class. Conditional jump or move depends on uninitialised value(s) is not a crash: your program made a decision using a variable that was never written, and the outcome depends on whatever garbage happened to be on the stack.
Then take the top frame of the trace, the one marked at. That is where the error happened, and it is almost always the only frame you need. Here it is main (leakcheck.c:11), which is the if (total > 0) line. Frames marked by are callers, and they are there to give you context, not to blame.
Open the file, look at that line, and ask what the compiler could not know. For an invalid access the top frame is the access. For a leak the top frame is where the error was noticed, which is at exit, so the useful information sits in a second block instead. You will see that shortly.
When a block is missing from your own code entirely, check that you compiled with -g before you start guessing. A frame of ??? means the binary has no debug information at that address, which is a build problem rather than a memory bug.
4. Reproduce and Fix the Error
Fixing means changing the code so the error class disappears, not so the message stops appearing. For the uninitialised read above, the fix is to initialise the variable: int total = 0;. Memcheck cannot tell you what the right value is; it can only tell you the value is undefined.
Reduce the failure to a small case before you change anything. Comment out half the program, keep the allocation and the bad access, and re-run. A report that reproduces on twenty lines is one you can reason about, and a report that reproduces on four thousand usually is not yet understood.
For a leak, the trace you want is the allocation site, and Memcheck prints it for you:
==12345== 40 bytes in 1 blocks are definitely lost in loss record 1 of 1
==12345==    at 0x4006B8: main (leakcheck.c:17)
==12345==    by 0x1081B99: __libc_start_main (/lib/x86_64-linux-gnu/libc.so.6+...)
Line 17 is the malloc for nums. Nothing ever frees it, so the block is still allocated when the program exits. The fix belongs wherever the pointer’s lifetime is managed, and in most C code that means the function that allocated it must also free it, or hand ownership to a caller in a way that is obvious from the function name.
5. Recheck with a Clean Build
Recompile from scratch and run the same command. A stale object file from an earlier build can carry old debug information, and the line numbers will disagree with the source you are reading. make clean handles this if you use a Makefile, or rm -f *.o prog by hand.
Fix errors in the order Memcheck reports them, one at a time, and re-run after each. A double free at the end of main stops the program before later code runs, so fixing that one line can reveal errors underneath it. Chasing several at once from a single report is how people convince themselves a leak is harmless.
You are done when the ERROR SUMMARY reads ERROR SUMMARY: 0 errors from 0 contexts and the leak counts you care about are zero. Keep the command in a Makefile so this is a one-word check from then on:
CC     = gcc
CFLAGS = -g -O0 -Wall -Wextra -std=c11

all: leakcheck

leakcheck: leakcheck.c
	$(CC) $(CFLAGS) $< -o $@

valgrind: leakcheck
	valgrind --tool=memcheck --leak-check=full --show-leak-kinds=all
	         --track-origins=yes --error-exitcode=1 ./leakcheck

clean:
	rm -f leakcheck

.PHONY: all valgrind clean
make valgrind is also the CI integration. Any non-zero exit fails the step, and adding --quiet plus a saved log keeps the build output readable.
Understand the Most Common Valgrind Errors
Five error classes account for nearly every report a C beginner sees. Each one has a recognisable header, a cause, and a specific fix.
Invalid read and invalid write of size N
==12345== Invalid write of size 1
==12345==    at 0x4006D0: main (leakcheck.c:14)
==12345==  Address 0x5dc2a40 is 0 bytes after a block of size 16 alloc'd
==12345==    at 0x4C2B34A: malloc (/usr/lib/valgrind/vgpreload_memcheck.so+...)
==12345==    by 0x4006A0: main (leakcheck.c:13)
The size tells you the width of the access, so size 1 is a character, size 4 is usually an int on a 32-bit target. The phrase “0 bytes after a block of size 16 alloc’d” is the useful one: your strcpy started writing into a 16-byte buffer and ran past its end. Off-by-one errors show up as “1 byte before” or “1 byte after” a block of a neighbouring allocation.
The fix depends on intent. If the string is meant to fit, make the buffer big enough or copy less. If it can be any length, the buffer is a design problem and needs realloc as it grows. Writing past the end of a heap block is a heap buffer overflow, and the same code with a stack array is a stack buffer overflow that is far more likely to corrupt unrelated memory silently.
Invalid free, double free and mismatched allocation
==12345== Invalid free() / delete / delete[] / realloc()
==12345==    at 0x4C30D25: free (/usr/lib/valgrind/vgpreload_memcheck.so+...)
==12345==    by 0x4006F0: main (leakcheck.c:22)
==12345==  Address 0x5dc2a50 is 0 bytes inside a block of size 16 free'd
==12345==    at 0x4006E0: main (leakcheck.c:21)
==12345==    by 0x4006E0: main (leakcheck.c:21)
This is a free() on memory that was already freed, and the second trace tells you exactly where. Memcheck also reports the mirror-image mistake of freeing with free() a pointer that came from calloc through a different allocator, or freeing a pointer into the middle of a block rather than its start.
After a realloc failure the original pointer is still valid, and freeing it in the error path then freeing the new pointer is the classic double free this pattern produces:
int *tmp = realloc(nums, 8 * sizeof *nums);
if (tmp == NULL) {
    free(nums);      /* correct: nums was never overwritten */
    return 1;
}
nums = tmp;          /* only now does the old pointer go away */
Assigning the realloc result to a different variable is the fix people reach for automatically once they have seen this report.
Use of uninitialised values
Two headers cover this. Conditional jump or move depends on uninitialised value(s) means a branch used an unwritten value. Use of uninitialised value of size 8 means the value was passed somewhere that read it, for example into printf with %s or as a function argument that expects a pointer.
With --track-origins=yes Memcheck adds a second block naming the instruction that last wrote the value, which usually turns the fix from a guess into a one-line change. Uninitialised stack variables are the most common source, because locals are not zeroed the way the heap is. Uninitialised struct members and calloc followed by an early partial free and later reuse of the pointer show up too.
Memory leaks and the leak summary
Leaks are only reported at exit, and only if you ask. The block ends the program with everything Memcheck expects as:
==12345== LEAK SUMMARY:
==12345==    definitely lost: 40 bytes in 1 blocks
==12345==    indirectly lost: 0 bytes in 0 blocks
==12345==      possibly lost: 0 bytes in 0 blocks
==12345==    still reachable: 0 bytes in 0 blocks
==12345==         suppressed: 0 bytes in 0 blocks
==12345== ERROR SUMMARY: 4 errors from 4 contexts
The categories are the single most confusing part of any Valgrind report, so here is what each one means and whether it deserves your attention.
| Category | What it means | Fix it? |
|---|---|---|
| Definitely lost | No pointer to the block exists anywhere at exit. Nothing can ever reach it again. | Yes. This is a real leak and it grows for the life of the process. |
| Indirectly lost | The block itself is unreachable, but it points at other blocks that are also unreachable. | Yes. Fix the parent block and these usually disappear with it. |
| Possibly lost | Only an interior pointer survives, so Memcheck cannot prove the block is unused. Usually a pointer stored as an int instead of a pointer type. | Usually. It is a smell, not always a bug. |
| Still reachable | A pointer to the start of the block exists somewhere at exit, often in a static or global. | Usually not. This is what a library cache or a single global buffer looks like. |
| Suppressed | Errors hidden by a suppression file or the shipped default suppressions. | No, unless you wrote the suppression yourself. |
Treat definitely and indirectly lost as errors. Treat still reachable as a note about program design rather than a bug, and do not let a big still-reachable number teach you to ignore the tool.
Valgrind Basics for C Programmers: Useful Options and Limits
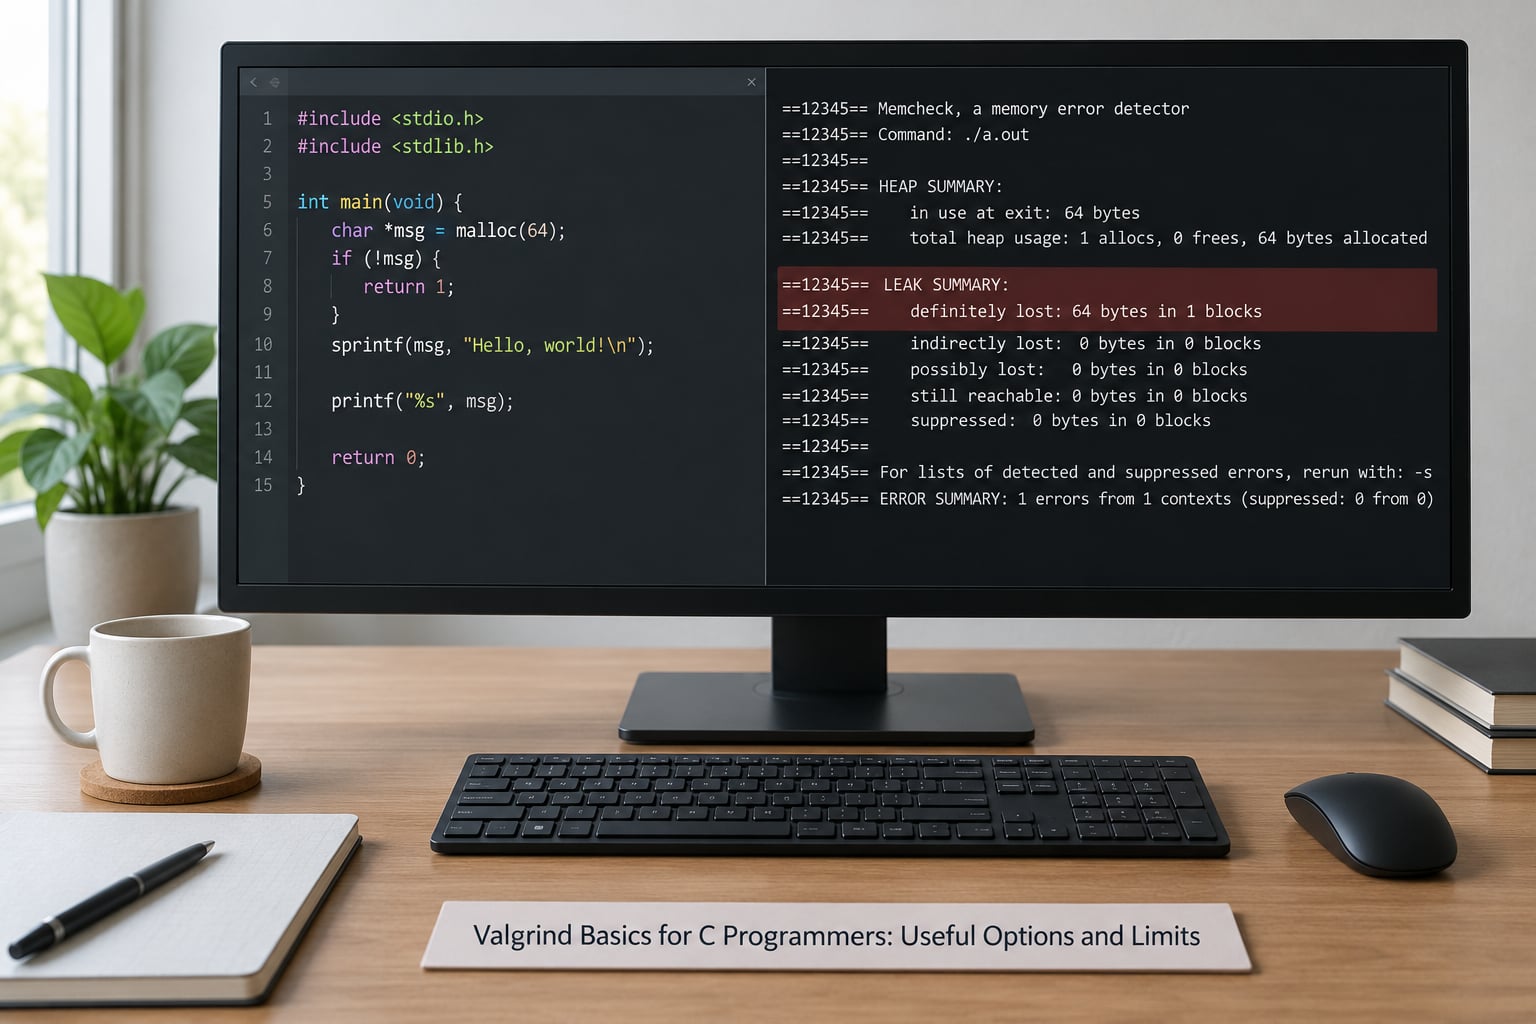
Almost everything beginners need is behind a short list of options. These are the ones I keep within reach.
| Option | What it does |
|---|---|
--leak-check=full | Adds the per-block leak records and the LEAK SUMMARY. Turn this on first. |
--show-leak-kinds=all | Shows every leak category, including still reachable and possibly lost, not just definite ones. |
--track-origins=yes | Traces uninitialised values back to the instruction that should have written them. |
--error-exitcode=N | Exits with status N when errors are found. Required for build systems and CI. |
--num-callers=N | How many frames to print per trace. Raise it for deep call stacks, lower it to cut noise. |
--error-limit=no | Reports every error instead of stopping after a set number. Slower, but nothing hides. |
--keep-debuginfo=yes | Keeps line info even when running on a stripped binary. Useful for release builds. |
--suppressions=file.supp | Loads a suppression file to hide known library noise. |
--gen-suppressions=all | Prints a ready-to-paste suppression for every error, as a starting point. |
--undef-value-errors=no | Silences uninitialised-value errors so you can focus on leaks while noise is present. |
One more worth knowing is --tool=, which switches to a different tool. The rest of the suite is small, and each answers a different question:
| Tool | Finds | Command |
|---|---|---|
| Memcheck | Invalid reads and writes, leaks, use of uninitialised data, invalid frees. The default. | valgrind ./prog |
| Callgrind | Instruction counts per function, showing where the work happens. Slow but exact, unlike wall-clock timing. | valgrind --tool=callgrind ./prog |
| Cachegrind | Simulated cache and branch behaviour from those instruction counts, so you can estimate performance without hardware counters. | valgrind --tool=cachegrind ./prog |
| Helgrind | Data races and lock-order problems in threaded code. | valgrind --tool=helgrind ./prog |
| DHAT | Total allocation volume over the run, to find who allocates the most rather than what leaked. | valgrind --tool=dhat ./prog |
| Massif | Heap usage over time as a graph, for programs whose memory grows steadily. | valgrind --tool=massif ./prog |
Callgrind and Cachegrind are related but not the same: Callgrind collects instruction counts, and Cachegrind simulates caches from its own counts. The blog posts that call them the same tool are simply wrong.
Third-party noise is the other practical issue. Reports that point into vg_replace_malloc.c, into libc, or into a container runtime are usually instrumentation artefacts rather than your bug. Filter them with a suppression file, and generate a first draft with --gen-suppressions=all. The output is verbose, so trim it to a name plus one or two frames and save it as known.supp:
{
   library-noise-ignore
   Memcheck:Leak
   match-leak-kinds: reachable
   fun:malloc
   ...
   fun:some_library_init
}
Valgrind is not a debugger. It cannot set a breakpoint, step line by line, or inspect a variable’s value the way GDB can. GDB finds the crash; Valgrind finds why the program was allowed to reach that crash. Using them together works well: read the report, note the file and line, then set a breakpoint just above it and step through the real logic.
| Tool | Setup | Speed | Best for |
|---|---|---|---|
| Valgrind | None, if you already have -g symbols | 20 to 100x slower | Leaks, uninitialised data, existing binaries you cannot rebuild |
| AddressSanitizer | Rebuild with -fsanitize=address | 2x slower | Fast CI feedback, use-after-free, out-of-bounds |
| UndefinedBehaviorSanitizer | Rebuild with -fsanitize=undefined | Small | Signed overflow, bad shifts, misaligned access |
| GDB | Debug symbols | Normal speed | Crashes, stepping, inspecting live state |
If you control the build and want speed, compile with AddressSanitizer. If you cannot rebuild the binary, or you are debugging a custom or pooled allocator, Valgrind remains the tool that works. Experienced developers tend to keep both, and they are not mutually exclusive, though running Memcheck on an ASan build mostly wastes time.
Know the limits. Valgrind only sees code paths your test inputs actually reach, so an untested branch is invisible. Errors that depend on exact heap layout can appear or disappear under it, since the allocation pattern differs from a normal run. Memory-mapped files, custom mmap-based allocators, JIT-compiled code and hand-written assembly are largely outside what Memcheck tracks. And a clean report is not proof of correctness: it means the memory operations on those paths were legal, not that the logic was right.
Common Mistakes
Almost every frustration I have seen with this tool traces back to one of these.
Compiling without -g. This produces ??? in every frame and reads as a broken installation. Rebuild with debug symbols before concluding anything about the tool.
Ignoring leak categories. Treating a large still-reachable count as a crisis leads people to ignore the definite leaks in the same block. Use the table above and judge each line on its own.
Reading library noise as your own bug. Frames in vg_replace_malloc.c or in a shared library you did not write are usually artefacts. Check the frame below them before you start changing code.
Running with unrepresentative inputs. A clean report on three lines of test data tells you almost nothing. Run it over your unit tests or a real workload, which is where the value is: users report that valgrinding an existing test suite is usually the moment it clicks.
Using the optimiser while debugging. Inlined functions move reported lines away from the source you wrote. Keep -O0 until the bug is fixed.
Treating a clean report as a certificate. Memcheck verifies memory legality, not intent. A leak-free program can still have wrong logic, and it can still leak on a code path you never exercised.
Suppressing too much. A broad suppression hides the real error along with the noise. Suppress the specific library frame, not the error class, and re-read the report after every change.
Two habits make this much faster over time. Keep the make valgrind target from the earlier section and run it before every commit, and when a bug does not reproduce under Memcheck, note that separately rather than assuming the fix worked.
Frequently Asked Questions
How do I install Valgrind on Ubuntu?
Use your distribution’s package manager: on Ubuntu or Debian run sudo apt update u0026amp;u0026amp; sudo apt install valgrind, on Fedora or RHEL run sudo dnf install valgrind, and on Arch run sudo pacman -S valgrind. On macOS use brew install valgrind. Windows has no native port, so install WSL2 and add Valgrind inside that Linux environment. Verify with valgrind u002du002dversion before you continue.
What does u0022definitely lostu0022 mean, and should I fix u0022still reachableu0022?
Definitely lost means no pointer to that block survives anywhere when your program exits, so nothing can reach it again and the memory is gone for good. Indirectly lost blocks are reachable only from other leaked blocks. Still reachable means a pointer to the start of the block still exists, often in a global, which is often a deliberate cache rather than a bug. Fix definite and indirect leaks, and treat still reachable as a design note.
Do I really need to compile with -g to use Valgrind?
Yes. Without -g the binary carries no file and line information, and every frame in the report prints as ??? instead of something like leakcheck.c:22. Compile with gcc -g -O0 so Memcheck can map addresses back to your source. If you must run an already-built binary, add u002du002dkeep-debuginfo=yes, which is slower and still cannot recover symbols the build never produced.
Why is Valgrind so much slower than running my program directly?
Valgrind replaces the CPU with a pseudo-CPU, translates every machine instruction into an intermediate form, and runs each block through a JIT translation cache. Memcheck also maintains extra bookkeeping for every allocated and uninitialised byte. That combination typically costs 20 to 100 times the normal runtime, which is why it suits small test cases and unit tests rather than long batch jobs. AddressSanitizer is roughly twice as slow, so it wins in tight CI loops.
What can Valgrind not find?
Valgrind only inspects code your inputs actually execute, so bugs on untested paths stay invisible. Errors that depend on exact heap layout may behave differently because the allocation pattern under instrumentation is not the normal one. Memory-mapped files, custom mmap allocators, JIT-compiled code and hand-written assembly are largely outside what Memcheck tracks. A clean report also says nothing about logic errors, only that the memory operations it saw were legal.
Conclusion
Start with one small representative test: compile it with gcc -g -O0, run it under valgrind --leak-check=full --track-origins=yes, and fix the first error it reports before you read anything else. Repeat one error at a time until the ERROR SUMMARY reads zero.
Then put that command in a Makefile target and run it over your unit tests before every commit. That habit, more than any single flag, is what turns the valgrind basics in this guide into a debugging workflow you keep using.