
A memory leak is memory your program allocates and never hands back, usually because a reference you forgot about keeps the object reachable. Finding one takes four moves: fix the workload, watch memory across many repetitions, take a snapshot before and after, then follow the retainers path back to the line of code holding on. It usually takes 30 to 90 minutes once the test case is reproducible.
The reason this question gets asked so often is that garbage-collected languages take the easy half away and leave you with the hard half. Nobody has to forget a free() anymore, but a listener you registered and never removed is just as fatal as a missing delete.
What follows is the workflow I use regardless of stack: Java service, Node process, browser tab, or C++ binary. Tool names change; the sequence does not.
Table of Contents
- What You Need to Investigate a Memory Leak
- Step-by-Step: What Is a Memory Leak and How to Find One
- Confirm the Leak and Set a Baseline
- Measure Memory During a Controlled Test
- Take a Heap or Allocation Snapshot
- Locate the Code That Retains Memory
- Fix the Leak and Verify the Result
- Common Mistakes When Hunting Memory Leaks
- Frequently Asked Questions
- Does memory always increasing mean there is a memory leak?
- What is the difference between a memory leak and a memory-intensive application?
- How can I find a memory leak in a long-running program?
- Do garbage-collected languages such as Java, C#, or JavaScript still have memory leaks?
- Can a memory leak be caused by native code or an operating-system resource?
- When should I use a heap snapshot instead of a basic memory monitor?
What You Need to Investigate a Memory Leak
Most investigations stall because the test case is not repeatable. Get these in place first and the rest is mechanical.
- A reproducible test case. One action, scriptable, ten seconds or less to run. Open a modal, publish a message, render a chart, handle a request.
- A baseline. Memory after startup settles, before the action repeats. Without this you are just watching a number move.
- Application logs with timestamps. Especially for anything async, so you can line up a memory step with the request that caused it.
- A debugger with a breakpoint-on-exception and watch views. You will want to inspect the retaining collection once you know its type.
- A memory profiler. Java: VisualVM, JProfiler, YourKit, or Eclipse MAT for heap dumps. JavaScript and Node: Chrome DevTools Memory panel or the Node inspector. C and C++: Valgrind memcheck, LeakSanitizer, or AddressSanitizer. Native code on Windows: the CRT debug heap and Visual Studio diagnostics.
- A heap dump or allocation recording. Two snapshots are better than one, because a single snapshot cannot tell you what changed.
- Version control. Bisect the leak. If it arrived in a release six commits back, you have already found it.
Exact menu paths and flag names differ per language, runtime, and operating system, so treat anything specific below as an example of the shape of the tool rather than a universal recipe. If you work across stacks, keep a short note of where your own runtime’s memory view lives. Most of my time lost on this topic went to hunting a menu, not a bug.
Step-by-Step: What Is a Memory Leak and How to Find One

Five steps, in order. Skipping ahead to the profiler is the single most common way to spend a day and learn nothing.
Confirm the Leak and Set a Baseline
A leak is not “memory went up.” It is memory that never comes back down after the work that caused it is done. Distinguish four behaviours before you start reading snapshots.
| Behaviour | What you see | Verdict |
|---|---|---|
| Expected growth | Memory rises for the first few cycles, then flattens | Not a leak. Warm-up, JIT compilation, connection pools filling |
| Cache growth | Rises, then plateaus once the working set is covered | Not a leak unless the cache is unbounded or never evicted |
| Delayed collection | Dips after a collection or an idle period | Not a leak. Trigger a collection and re-measure |
| Fragmentation | Used memory rises, live object total stays flat | Not a retention leak, but it still causes the crash |
| Unbounded retention | Live object count climbs every cycle and never drops | Real leak. Go to snapshots |
To set a baseline, start the process, let it idle until memory stabilises, and record three numbers: total process memory, live object count, and heap used after a forced collection if your runtime lets you force one. Write those numbers down. You will compare against them at the end instead of arguing with your memory of what it looked like an hour ago.
Measure Memory During a Controlled Test
Now run the same action 50 to 200 times and watch what happens after each cycle. The shape of the curve is the evidence, more than any single reading.
- In a browser, the task manager panel under the browser’s own menu shows memory per tab, and the Performance Monitor panel inside developer tools shows JS heap size, DOM node count, and listener counts live.
- On the operating system, the task manager or activity monitor shows resident memory for the process, with a useful split between shared and private pages.
- On the JVM, jstat gives you a running view of heap and garbage collection behaviour, and JMX exposes the same numbers to monitoring tools.
- In a native process, RSS plus the platform’s memory counters, with attention to how many handles or mappings are open.
Give the process time to settle between batches. On a managed runtime, memory often stays high after a spike and only returns to baseline once collection runs, so a measurement taken five seconds after the workload ends will convince you of a leak that isn’t there.
If memory climbs roughly in line with the number of repetitions and shows no flattening, you have the shape of a real leak. Record how much each cycle costs you. A few hundred kilobytes per cycle is an afternoon of work; several megabytes per cycle is the thing that took a dashboard from 150 MB to 1.4 GB over a working day.
Take a Heap or Allocation Snapshot
Monitoring tells you that memory grows. Only a snapshot tells you what is growing and why. You generally want two: a baseline snapshot before the loop, and a second one after, with the workload between them and a collection triggered before each capture.
Heap snapshots record every live object at a moment in time. The comparison view sorts objects by what grew between the two captures, and the two numbers that matter are shallow size, the memory the object itself takes, and retained size, the memory that would be freed if this object became unreachable.
Four things to look for in a diff:
- Objects that grew by a count matching your cycle count. One extra object per iteration is your allocation site. Ten thousand extra nodes after ten thousand iterations is not a rounding error.
- Retained size on a container. One dictionary or map holding ten thousand small objects is far more interesting than ten thousand small objects, because the retained size shows the whole graph underneath it.
- Detached DOM nodes in the browser. Open and close a modal twenty times; if the node count in the snapshot grows with every close, something still points at the removed subtree.
- Allocation stacks or an allocation timeline. This is the faster route when you know roughly when the growth happens: record allocations during a short run, group by call stack, and the stack that dominates is your suspect.
If you are on the JVM, take a heap dump instead of a snapshot and open it in Eclipse MAT. The leak suspects report there ranks classes by retained heap and gives you the shortest path from a GC root to the leaking object, which saves an hour of clicking.
Locate the Code That Retains Memory
This is the step where the retainer path turns into a filename. Read the reference chain from the surviving object back to something you control: a static field, a module-level collection, a long-lived listener registry, an active timer, a thread-local, an open file or socket.
The usual suspects, in the order I look for them:
- Event listeners and subscriptions registered on a long-lived object and never removed. The listener holds the closure, the closure holds the component, and the component holds a whole view.
- Callbacks and closures that captured far more than they need. A callback on a timer that closes over an entire application state object keeps that object alive for as long as the timer runs.
- Caches with no eviction policy. A lookup table that only ever grows is a leak with a nicer name.
- Static or global collections that outlive every request but are never cleared between them.
- Timers, intervals, and animation frames that keep rescheduling themselves after the component is gone.
- Thread-locals and thread pools holding values set on a worker thread that is then returned to the pool.
- Unclosed resources such as files, sockets, streams, and database handles. Garbage collection will not release an unmanaged handle for you.
Worked example. In a browser app, memory climbed steadily while a dashboard stayed open. The snapshot diff showed one extra detached subtree per filter change, all of them containing the same chart component. The retainers view on the first detached node led to a global event bus, then to a module-level map keyed by element id, and the map was the last entry in the chain. Every filter change wrote a new chart into a map nobody cleared. The fix was a bounded cache that evicts the oldest entries, and the memory curve flattened on the next identical run.
// before: map grows with every filter change, entries are never released
const chartsByElement = new Map();
function renderChart(elementId, data) {
  chartsByElement.set(elementId, new Chart(elementId, data));
}

// after: bounded cache, oldest entry evicted when the cap is reached
function renderChart(elementId, data) {
  if (chartsByElement.size >= 50) {
    const oldest = chartsByElement.keys().next().value;
    chartsByElement.get(oldest).destroy();
    chartsByElement.delete(oldest);
  }
  chartsByElement.set(elementId, new Chart(elementId, data));
}
For native code the same idea applies with different nouns. Valgrind memcheck prints the allocation stack for every block that is still live at exit, and LeakSanitizer prints the stack for blocks it can attribute. An allocation that only shows up on the third run of the same test is nearly always a leak that a fresh process never gets to exhibit.
Fix the Leak and Verify the Result
Remove the retaining reference rather than forcing collection. Unregister the listener, cancel the timer, close the handle, clear the entry, and dispose the subscription in whatever lifecycle hook your framework provides: an effect cleanup in React, an unmounted hook in Vue, a destroy hook in Angular, a defer block in Go, or a try-with-resources in Java.
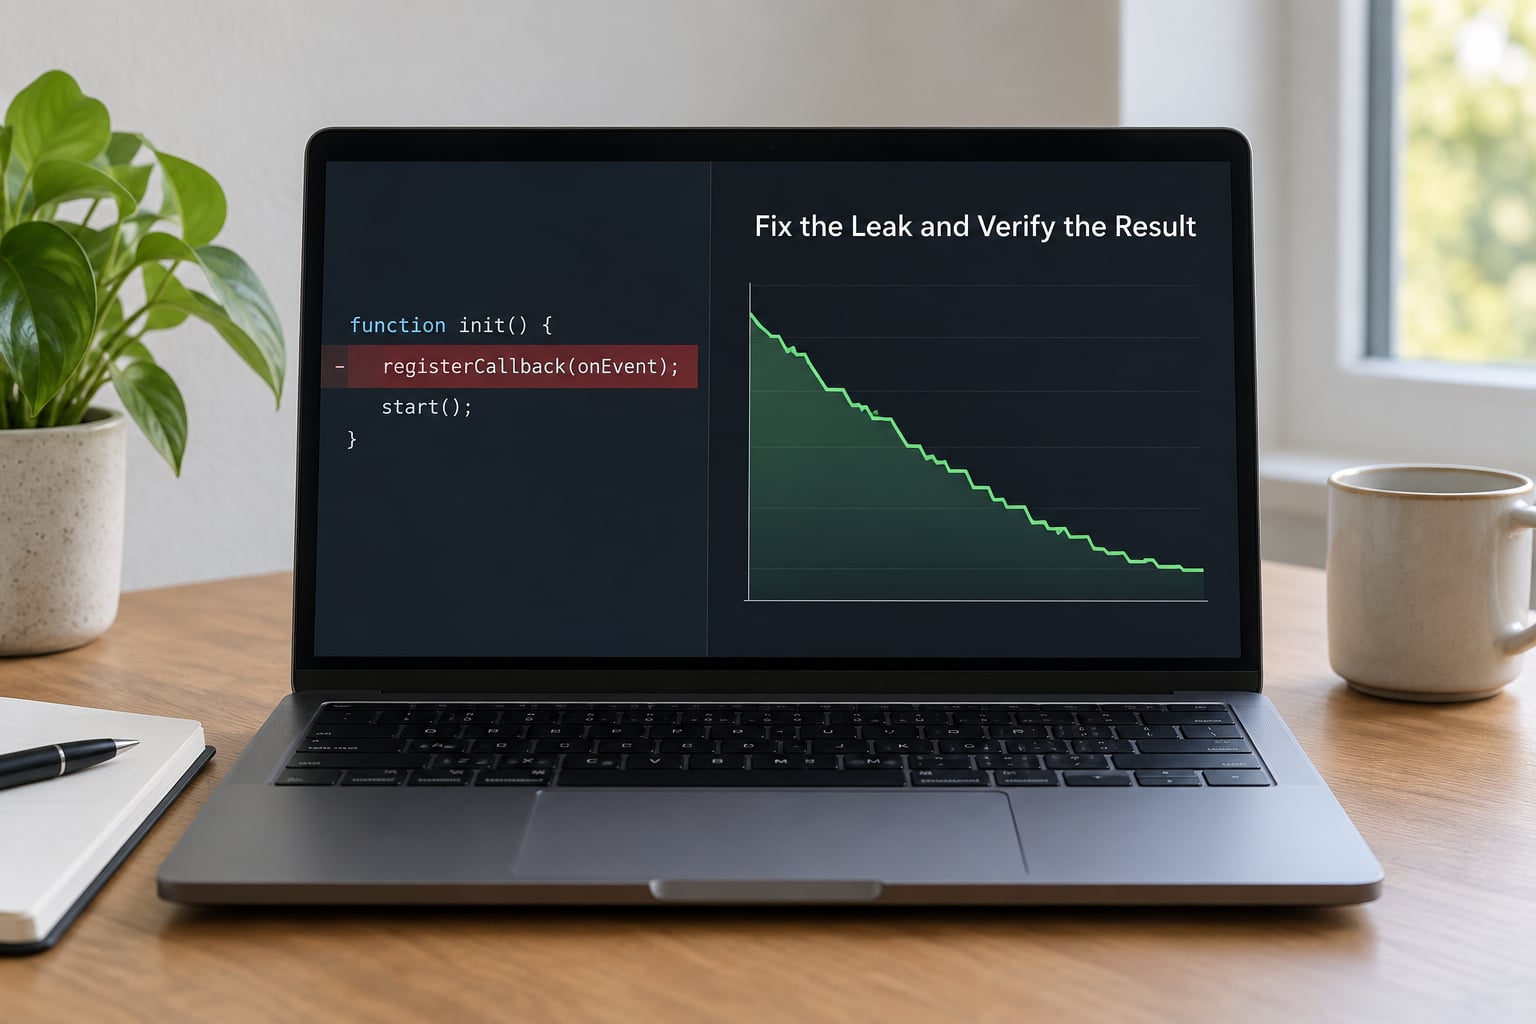
If the reference existed to make something convenient, bound it rather than deleting the feature. A small fixed-size cache, an expiry on the subscription, or a weak reference in a lookup table keeps the behaviour and drops the growth.
Then verify it properly, which means repeating the identical test against the identical baseline:
- Run the same action the same number of times as before.
- Force a collection, then read the same three numbers you recorded at baseline.
- Take a final snapshot and diff it against the first one. The objects that grew should be gone or flat.
- Run the test a second time. A fix that only delays the growth shows up immediately as a smaller slope, not a flatter line.
If the post-fix number lands near your baseline, you fixed the leak. If it lands lower but the slope is unchanged, you removed one retainer and left another, and the second snapshot diff will name it.
Common Mistakes When Hunting Memory Leaks
Most wasted hours come from a handful of recurring mistakes. Each one has a simple correction.
- Treating every increase as a leak. Warm-up, lazily created caches, and connection pools all raise memory once. Correction: wait for the curve to flatten before you call anything a leak.
- Testing with inconsistent workloads. If iteration 20 handles twice the data of iteration 1, growth is expected. Correction: hold the input identical and vary only the repetition count.
- Relying on one measurement. A single reading is a snapshot of a moving target. Correction: sample on a curve across dozens of cycles.
- Ignoring fragmentation. Live objects stay flat while used memory climbs, and it still ends in an out-of-memory crash. Correction: compare retained size of live objects against process memory, not one against the other.
- Measuring before collection runs. Managed runtimes return memory on their own schedule. Correction: trigger a collection, allow a pause, then measure.
- Failing to reproduce under realistic conditions. Leaks that only appear after hours of uptime, under concurrency, or with production data volumes will not show up in a five-minute local test. Correction: use a long load run, and if you can, a staging environment with production-like traffic.
- Assuming garbage collection frees unmanaged resources. File handles, sockets, and native buffers sit outside the collector’s view. Correction: audit resource lifetimes separately from object lifetimes.
- Profiling only on a developer machine. Timing, allocator behaviour, and data volume differ, and slow leaks often need hours of running time to become visible. Correction: reproduce under sustained load before you conclude anything.
One habit worth building: capture two snapshots as part of an automated test on every build. A test that renders a component a hundred times, forces collection, and asserts that memory returns to within a small margin of its baseline catches the slow leaks long before a user reports sluggishness after six hours.
Frequently Asked Questions
Does memory always increasing mean there is a memory leak?
No. Memory rises during warm-up, while caches fill, and while connection pools reach their steady size, then stops. A leak keeps growing after the workload stops and has no plateau. The test is the shape of the curve across many repetitions, not one reading. If memory climbs in proportion to your cycle count and never flattens, you have a retention problem. If it flattens, you have normal lazy allocation.
What is the difference between a memory leak and a memory-intensive application?
A memory-intensive application uses a lot of memory by design: a video editor, an indexer, a data frame library. Its usage stays high but bounded. A memory leak holds memory that is no longer needed, so usage grows past what the current work requires and keeps growing after that work ends. The distinguishing question is whether the memory in use corresponds to something live, or to objects the program has already finished with.
How can I find a memory leak in a long-running program?
Reproduce the trigger on a short cycle first, then confirm it at scale. Run the triggering action many times, sample memory on a curve, and check for growth with no flattening. Take two heap snapshots with the workload between them and diff them to find which object types grew. Then follow the retainers path from a surviving object back to a root you control. Once fixed, repeat the identical run and compare against the same baseline.
Do garbage-collected languages such as Java, C#, or JavaScript still have memory leaks?
Yes, absolutely. A collector only frees memory that has become unreachable, so any lingering reference is enough. Static collections, unremoved event listeners, callbacks that capture large objects, caches without eviction, and thread-locals that keep values on pooled threads all leak in managed languages. The collector handles the mechanics; deciding what should stay reachable is still your job.
Can a memory leak be caused by native code or an operating-system resource?
Yes. Third-party native libraries, graphics stacks, and database drivers allocate outside the managed heap, so managed heap numbers stay flat while process memory climbs. Unclosed file handles, sockets, and subprocesses leak at the operating-system level too, which shows up as growing handle or file-descriptor counts rather than heap growth. Track process memory and handle counts alongside your heap metrics, and test suspect dependencies in isolation.
When should I use a heap snapshot instead of a basic memory monitor?
Use a monitor to answer whether memory grows, and use snapshots to answer what is growing and why. Start with monitoring because it is cheap and tells you whether you have a problem worth investigating. Move to snapshots once growth is confirmed, because they are heavier: they pause the process, and a large snapshot on a big heap takes noticeable time. Always take two so you have something to diff.
If you take one thing from this, make it the baseline. Write down what memory looks like after a settled startup, run your action a hundred times, and compare. Everything else follows from whether that curve flattens.
And when it does not, the snapshot diff plus the retainers path will point at the line. That is the whole answer to what is a memory leak and how to find one: measure the shape, snapshot the difference, and follow the reference back to the code that should have let go.