To test your home network speed properly, plug a computer into the router with Ethernet, pause every download and cloud sync, turn off your VPN, then run a third-party speed test three times in a row and report the middle result. Do that before you blame the ISP, the router, or your Wi-Fi.
The reason most speed tests are useless is that they measure a messy system. A single run over Wi-Fi at 9pm with a 4K stream running in the background tells you almost nothing about the line to your house.
What you actually need to measure is three different things: the internet line from your ISP, the wired LAN throughput between two devices, and the Wi-Fi throughput from an access point. Each one has a different number that counts as normal, and each one points at a different fix.
This guide walks through all three, in the order that isolates problems fastest. Last updated for 2026, and every method here runs on a laptop you already own.
Table of Contents
- What You Need
- Step-by-Step: How to Test Your Home Network Speed Properly
- Step 1: Establish a Fair Baseline
- Step 2: Measure Internet Throughput
- Step 3: Separate ISP and Local Network Problems
- Step 4: How to Test Wi-Fi Quality and Coverage
- Step 5: Inspect the Local Link and Device
- Step 6: Test Latency, Jitter, and Packet Loss
- Step 7: Compare Results and Repeat the Test
- Common Mistakes That Ruin Your Results
- Frequently Asked Questions
- What is a good network speed for home?
- Should I test with Ethernet or Wi-Fi?
- Why do different speed tests give different numbers?
- Why is my internet slow when the speed test looks fast?
- Will restarting the router fix my speed?
- When should I contact my ISP?
- Conclusion
What You Need
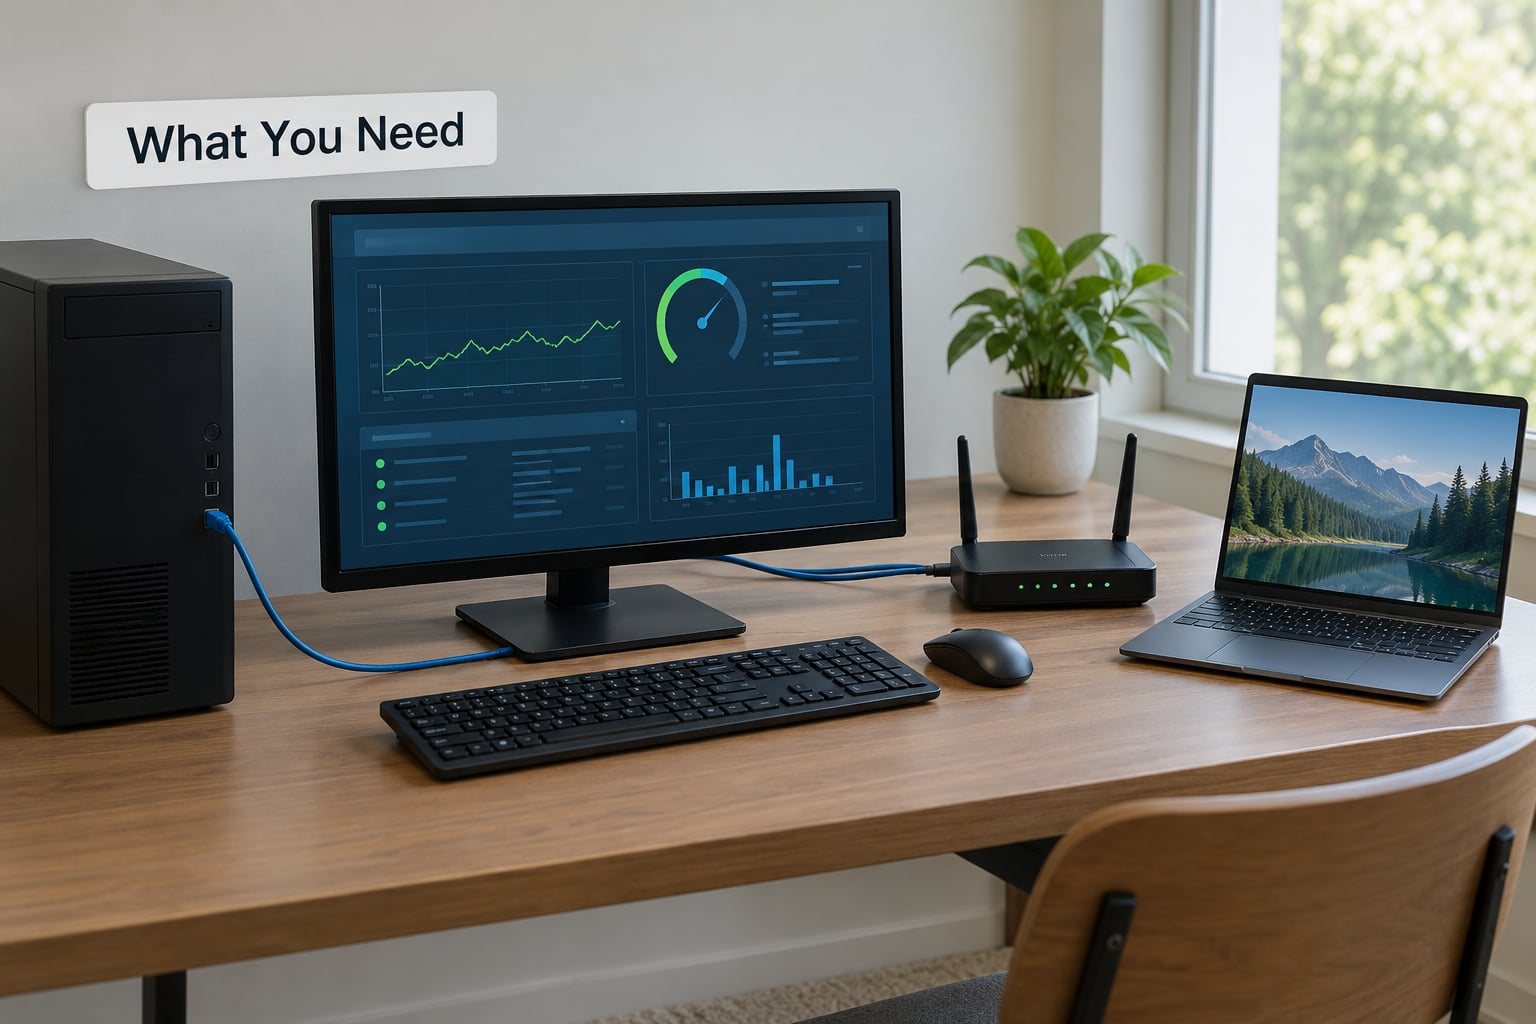
You do not need a bag of tools. A ten-minute setup with three free things covers every test in this guide.
- A wired Ethernet connection. A Cat5e cable carries 1 Gbps, Cat6 or Cat6a handles 2.5 and 10 Gbps. If you suspect your cable is the problem, swap it before anything else — a bad or undersized cable is the single most common cause of a suspiciously round 94 Mbps.
- A modern browser. Chrome, Edge, Firefox and Safari all handle the HTML5 speed test sites fine. Turn off any ad blocker for the test window, since some of them break the measurement script.
- A third-party speed test service. Ookla Speedtest, Fast.com and the Cloudflare Speed Test are the three I use. Skip your ISP’s own test page: the path to their servers is frequently optimised, which is exactly the number you are trying to verify.
- Ping and traceroute. Built into Windows, macOS and Linux. This is how you check latency, jitter and packet loss separately from throughput.
- iPerf3, optionally. Free and open source, and the only way to get a true LAN baseline between two machines on your own network.
- A phone, for Wi-Fi work. A Wi-Fi analyzer app turns signal strength into a number you can walk around the house with, room by room.
Step-by-Step: How to Test Your Home Network Speed Properly
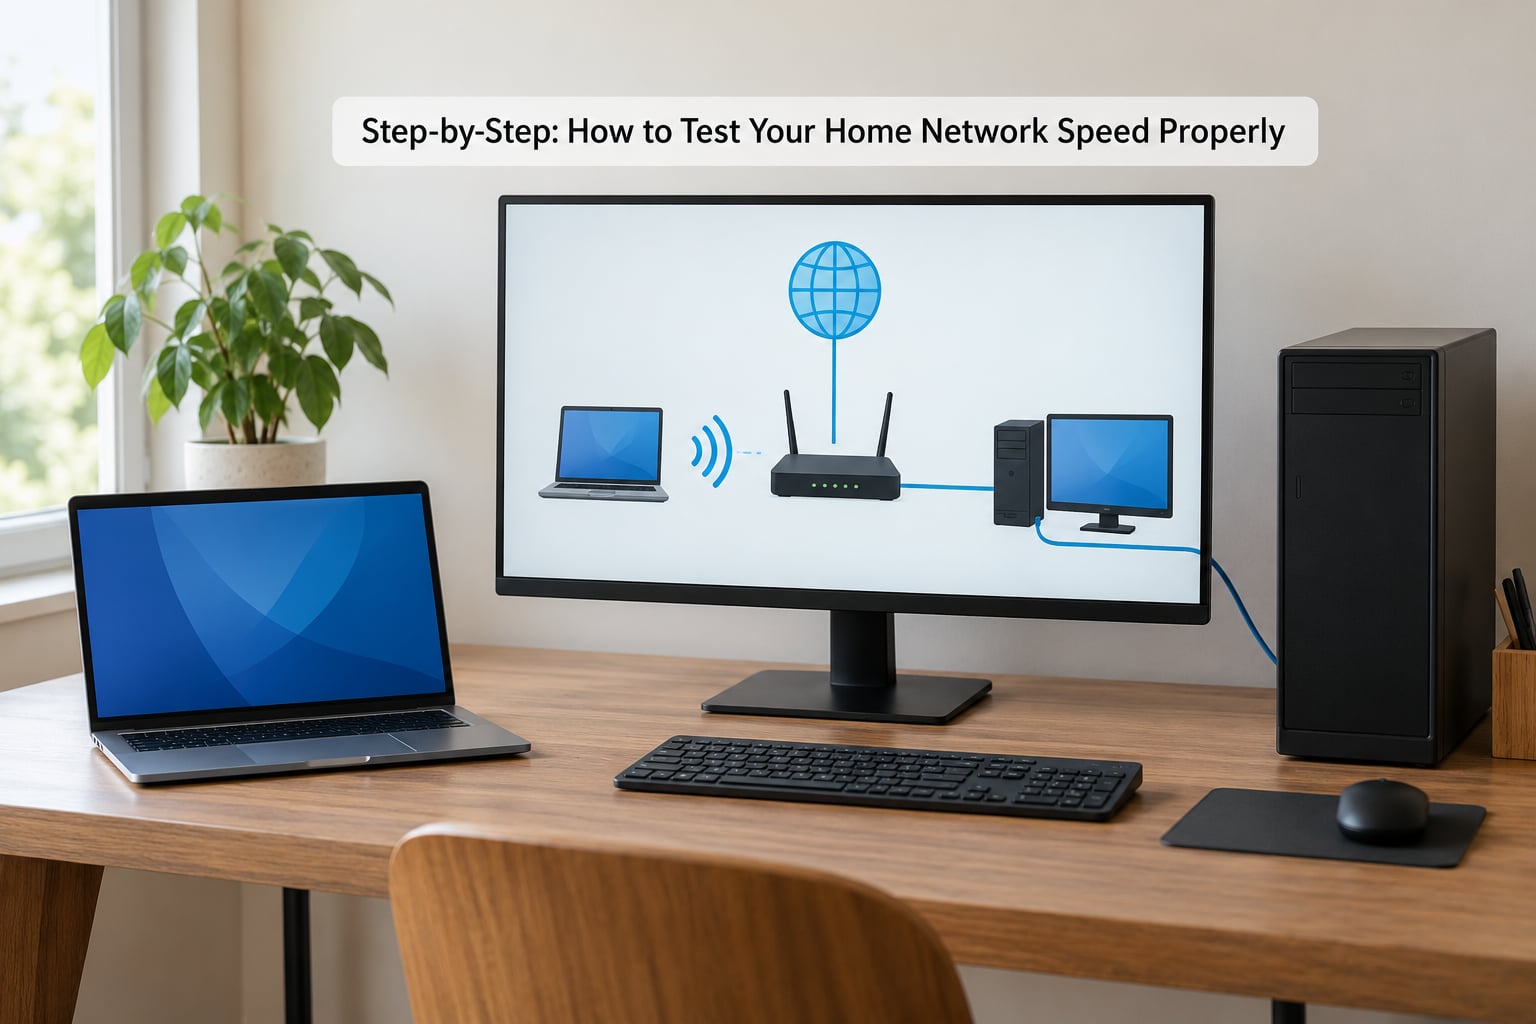
Step 1: Establish a Fair Baseline
Every result you collect later depends on the conditions you set up here. Spend five minutes on this or you will spend an evening chasing a number that was never real.
Connect by Ethernet if you possibly can. Pause downloads, cloud photo sync, system updates and any 4K stream. Disconnect the VPN and any proxy, because a full-tunnel VPN running on the machine can halve your throughput and nobody finds that number until they look for it.
Then write down four things before you start: which tool you are using, which server it picked, the date and time, and how the machine is connected. Without that, you cannot compare a test today to a test next week, and that comparison is the whole point.
You know the baseline is fair when nothing else on the network is competing for bandwidth. On a wired machine with traffic paused, any result you get is a property of your connection, not of your household.
Step 2: Measure Internet Throughput
Open the speed test, pick a server close to your home if the tool lets you choose one, and let it run. Record four numbers, not one: download speed, upload speed, idle latency in milliseconds, and loaded latency if the tool reports it.
Run it three times. Discard the first run — it pays for TCP warm-up and cache misses, and it is always low. Take the median of the remaining two, or of all three if you want to be generous. Then run the whole thing again at an off-peak hour, usually mid-morning or mid-afternoon.
| Plan speed | Ethernet, expected | 5 GHz Wi-Fi, expected | 2.4 GHz Wi-Fi, expected |
|---|---|---|---|
| 100 Mbps | 90-95 Mbps | 60-85 Mbps | 25-50 Mbps |
| 300 Mbps | 270-290 Mbps | 150-240 Mbps | 40-70 Mbps |
| 500 Mbps | 450-480 Mbps | 250-400 Mbps | 50-80 Mbps |
| 1000 Mbps | 900-940 Mbps | 400-700 Mbps | 60-100 Mbps |
On Ethernet, landing within about 10% of your plan speed is normal. Protocols eat overhead, and providers provision the line a little above the number on the bill, so a 1 Gbps plan landing at 910 Mbps is a healthy line, not a broken one.
Over Wi-Fi, expect 40 to 60% of plan speed at close range on 5 GHz, and a lot less on 2.4 GHz. Comparing a Wi-Fi result to your Ethernet plan is the most common category error in this whole topic, and it sends people to ISP support for a problem that lives in their own house.
Step 3: Separate ISP and Local Network Problems
Here is the fork in the road. Run the same test, same tool, same server, back to back — once on Ethernet and once on Wi-Fi — and compare.
| Symptom | Test that answers it | Healthy result |
|---|---|---|
| Everything is slow, everywhere | Ethernet speed test | Within 10% of plan |
| Fast in one room, slow in another | Wi-Fi analyzer walk-through | Signal within 10% of the router’s own room |
| Internet slow, file copies fine | Ethernet speed test plus ping | Throughput low, packet loss near zero |
| File copies between devices slow | iPerf3 on the LAN | Within 10% of the slowest NIC on the path |
| Smooth numbers, terrible calls and games | Latency under load | Loaded latency within a few times idle |
If Ethernet is fast and Wi-Fi is slow, the ISP line is fine and the problem is upstairs of the modem. If both are slow by a similar margin, the line itself is the suspect.
The most convincing proof of a healthy line comes from plugging a machine straight into the modem or ONT, bypassing the router entirely, and testing again. People on r/HomeNetworking treat this as the standard move before blaming a mesh system, and it settles the argument in about five minutes.
You know the ISP is at fault when a direct wired test still misses the provisioned rate by more than 15%, or when the modem’s downstream sync rate sits below your plan speed. That sync rate is the number the modem actually negotiated with the provider, and it is the figure support will ask you for.
Step 4: How to Test Wi-Fi Quality and Coverage
Wi-Fi speed has almost nothing to do with the label on the box. What matters is signal strength, channel congestion and which band your device picked, and you can measure all three.
First, test right next to the router. That result is your Wi-Fi ceiling for the whole house. Then walk to the room that feels slow and test again, standing where the device actually sits. The gap between the two numbers is your coverage problem, stated in Mbps.
Second, force the band. On most routers and laptops you can pin a device to 2.4 GHz or 5 GHz in the wireless settings, or disconnect from the SSID that has 5 in the name and join the 2.4 GHz one. If the slow room improves dramatically on 2.4 GHz, you were fighting interference on 5 GHz, and no amount of speed on 5 GHz was ever available to you there.
Third, look at channel congestion. A Wi-Fi analyzer app on your phone shows which channels nearby routers are using and how strong they are. 2.4 GHz has only three non-overlapping channels, so a handful of neighbours can saturate the band in seconds. 5 GHz has far more room and is almost always the better choice indoors, at the cost of range.
On a mesh setup, test each node individually by standing next to it before walking away. One weak node shows up as a sharp drop the moment you connect to it, and moving or replacing that unit fixes rooms it had nothing to do with.
Coverage is fine when the room that felt slow measures within about 10% of the number you got standing next to the router.
Step 5: Inspect the Local Link and Device
Before blaming anyone else, check what your own machine negotiated. On Windows, open Device Manager, expand Network adapters, open the Properties of your Ethernet adapter and look at the Speed field. It should read 1.0 Gbps, not 100 Mbps. On macOS, System Settings, then Network, then the Hardware tab shows the negotiated rate too.
A negotiated rate of 100 Mbps on gigabit service is a hardware fault until proven otherwise: a Cat5e run that is actually Cat3, a damaged cable, a port on an old switch, or a driver stuck at 10 Mbps. That symptom gets filed as an ISP ticket by most people, and the technician finds the cable.
Then rule out the machine. A laptop with a power-saving profile, a Windows laptop throttling its wireless card, or a browser with fifteen tabs of a video call in the background will all read low. Close everything, plug in, and test again.
iPerf3 gives you the number that proves the LAN itself is healthy. Run the server on one wired machine and the client on the other:
iperf3 -s
iperf3 -c 192.168.1.50 -R -t 10 -P 4
The -R flag reverses the direction to measure download, -t 10 sets a ten-second window, and -P 4 opens four parallel streams. Those parallel streams matter: a single TCP connection rarely pushes past a few hundred Mbps no matter how fast the line is, which is why casual tests read far below plan.
Run it three times and take the median. On gigabit LAN hardware you should see roughly 900-940 Mbps; anything near 100 means a link negotiating at 100, not a network underperforming.
Step 6: Test Latency, Jitter, and Packet Loss
Throughput tells you how much data moves at once. It says nothing about how fast a response comes back, and that is what makes a call or a game feel broken.
Ping a stable host twenty times from your wired machine and read the output:
ping -n 20 1.1.1.1
Use the average round-trip time for latency, the spread between the lowest and highest replies for jitter, and count the lines reporting lost packets. Under load, run the ping again while a large download is saturating the line. If idle latency is 15 ms and loaded latency jumps past 100 ms, you have bufferbloat: the router queues your packets instead of shedding them, and everything interactive waits behind a download.
A connection with 0% loss, 20 ms idle latency and 900 Mbps is better for calls than one with 0% loss and 60 ms, no matter what the big number says. Packet loss above 1% on a healthy home line is a fault worth reporting, not a rounding difference.
You know this step worked when you can state idle latency, loaded latency and loss percentage as separate numbers rather than folding them into a single feeling.
Step 7: Compare Results and Repeat the Test
Log every run. One row per test, same columns every time, is what turns a hunch into evidence you can hand to support.
| Connection | Download | Upload | Latency | Jitter | Loss | Time | Server |
|---|---|---|---|---|---|---|---|
| Ethernet | Mbps | Mbps | ms | ms | % | HH:MM | Server name |
| 5 GHz Wi-Fi | Mbps | Mbps | ms | ms | % | HH:MM | Server name |
| 2.4 GHz Wi-Fi | Mbps | Mbps | ms | ms | % | HH:MM | Server name |
| LAN iPerf3 | Mbps | Mbps | ms | ms | % | HH:MM | Local IP |
Upload running at a fraction of download is normal on residential lines, since providers provision upload far lower. Check your plan’s upload figure rather than assuming symmetry, and only treat the gap as a fault if it sits far below what you were sold.
Repeat the full set once a week for a month. What you are looking for is variance: a line that is usually 900 Mbps and occasionally 12 Mbps has a problem the median hides, and one off-peak reading will not catch it.
Before you contact a provider, screenshot the modem status page showing sync rates and signal levels, screenshot your results log with the timestamps, and note the server names and distances used. That is a complete case file, and it shortens the conversation.
Common Mistakes That Ruin Your Results
- Testing over Wi-Fi and comparing to your Ethernet plan. A 5 GHz result of 400 Mbps on a 1 Gbps line is normal, not a complaint.
- Leaving the VPN running. A full-tunnel client routes every packet through a remote server and can cut throughput in half.
- Believing a single run. One result is noise. Three runs, median reported, is a measurement.
- Testing during household activity. Console downloads, camera uploads and 4K streams compete for the same pipe. Pause them first.
- Reading Mbps as MBps. A 100 Mbps connection moves about 12.5 MBps. If a file copy looks eight times slower than the speed test promised, this is usually why.
- Using your ISP’s own speed test. The route to their servers is often optimised for exactly this page.
- Testing on a phone. Phone browsers add their own overhead and the radio switches bands mid-test. Fine for a rough check, wrong for a verdict.
- Ignoring latency because the big number looks fine. 940 Mbps with 90 ms loaded latency feels terrible to be on, and the throughput number hides that completely.
- Letting the tool pick any server. A congested server in another state caps your result for reasons that have nothing to do with your line.
- Calling the ISP before testing directly into the ONT. Half of those tickets come back as a cable or a router setting.
Frequently Asked Questions
What is a good network speed for home?
For most households, 100 Mbps is enough for streaming and browsing, 300 Mbps handles several simultaneous 4K streams, and anything above that matters mostly for large downloads, console gaming and a home lab. On Ethernet, expect to land within about 10% below your plan speed. Over 5 GHz Wi-Fi, expect 40 to 60% of the plan at close range, and considerably less on 2.4 GHz.
Should I test with Ethernet or Wi-Fi?
Both, in that order. Ethernet gives you a clean baseline for the line itself, with no wireless overhead in the way. Wi-Fi then tells you what your devices actually experience in each room. If you only ever test one, test Ethernet first, because a good Wi-Fi number means very little until you know what the line delivers.
Why do different speed tests give different numbers?
Usually the server, not your connection. Each tool picks a different server in a different city, and those servers have different capacity and routing. Test method matters too: some tools open several parallel connections and others use one, and a single stream rarely saturates a fast line. Fast.com also lets you not choose a server at all, which removes one variable you might want.
Why is my internet slow when the speed test looks fast?
Most often it is latency under load rather than throughput. Idle latency might be 15 ms, but it climbs past 100 ms while a download runs, and calls and games feel it immediately. Wi-Fi congestion in a far room and household background traffic cause the same effect. Test loaded latency with ping while transferring data and you will usually see it right away.
Will restarting the router fix my speed?
It fixes more than people expect. A router that has been up for months accumulates connection state, and a reboot clears it in about two minutes. It also re-syncs the modem, which can recover a line that dropped to a lower sync rate. If the problem returns within a day, the reboot is not the answer and you should be looking at heat, firmware or a failing unit.
When should I contact my ISP?
Call when a wired test directly into the ONT stays more than about 15% below your plan speed across several runs at different times of day. TestMy.net’s minimum and M-Lab’s NDT both produce a result you can cite in a dispute. Attach your results log, the modem sync rates and the timestamps, because a single screenshot of one peak number is the weakest evidence you can offer.
Conclusion
Start with one thing: a quiet house, a wired machine, no VPN, and three runs of the same test with the middle result written down. That single baseline tells you which of the other three problems you actually have.
From there the branches are short. Fast on Ethernet and slow on Wi-Fi means coverage or band congestion, and a walk-through with a Wi-Fi analyzer will find the room. Slow on both means the line or the modem, and a direct test into the ONT plus the sync rates decide which. Fast everywhere but miserable calls means latency under load, which is a queueing problem rather than a bandwidth one. A round 100 Mbps number on gigabit service is your cable, not your provider.
Keep the log. After a month of weekly results you will have something better than an opinion, which is the point of learning how to test your home network speed properly in the first place.