Learning how to read top and htop output comes down to one habit: work your way down the screen instead of hunting for the interesting number. Start with uptime and load average, then the CPU breakdown, then memory and swap, and only then read the process table. top ships with every Linux system; htop is an interactive replacement that draws the same kernel counters as color-coded meters.
Both tools read the same thing: counters the kernel exposes under /proc, mainly /proc/stat for CPU time and /proc/meminfo for memory. They sample those counters on a refresh interval (three seconds by default), work out the difference from the previous sample, and redraw. That detail explains most of the confusion people hit: nearly every number on screen is a rate over the last few seconds, not a lifetime total.
This guide was verified on Ubuntu and Debian systems running a Linux 6.x kernel, and rechecked in October 2026. Everything below works the same on RHEL-family boxes unless noted.
Table of Contents
- What You Need Before You Start
- Step-by-Step: How to Read top and htop Output
- 1. Launch the monitor and find the system summary
- 2. Read CPU percentages and load average correctly
- 3. Understand memory, cache, and swap figures
- 4. Inspect the process table and decode every column
- 5. Use sorting, search, and display controls
- 6. Correlate the metrics and troubleshoot a slow system
- Common Mistakes to Avoid
- Frequently Asked Questions
- How to interpret top command output?
- How is htop different from top?
- What does %CPU in top mean?
- How much load average is too much in Linux?
- How do I kill a process in htop?
- Conclusion
What You Need Before You Start
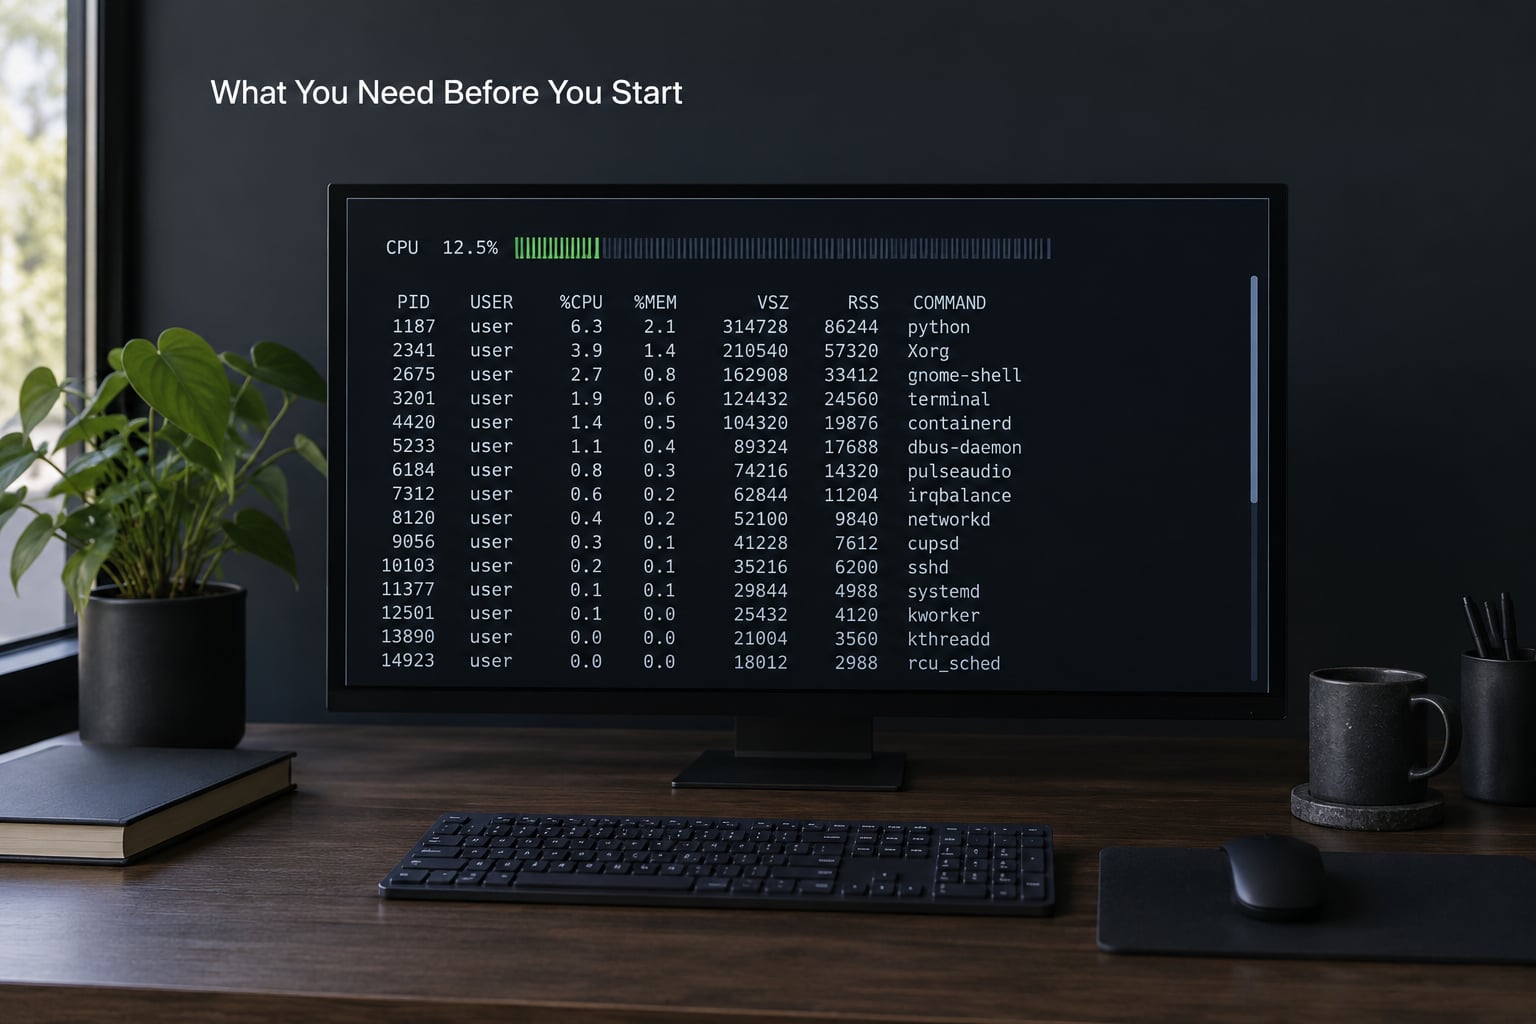
You need almost nothing, which is why this is a five-minute setup. Any local terminal, an SSH session, or a container shell will do.
- A terminal with a readable window. The header line packs five or six fields into 80 columns, so resize before you blame the tool for looking cramped.
top, which is part of procps and already installed on Debian, Ubuntu, RHEL and Arch.htop, if you want the friendlier view:sudo apt install htopon Debian and Ubuntu,sudo dnf install htopon Fedora and RHEL,pacman -S htopon Arch.sudoor a root shell to see other users’ processes. Without it, the list looks half-empty on a busy server.- Your core count, from
nproc. You cannot judge load average without it.
It also helps to know what neither tool can tell you. top and htop show CPU, memory, swap, and task state. They do not show network throughput, disk queue depth, or what happened five minutes ago. When you need those, you need vmstat, iostat, pidstat or sar.
Step-by-Step: How to Read top and htop Output
1. Launch the monitor and find the system summary
Type top and press Enter for the classic view, or htop for the graphical one. Both start updating immediately; press q to quit. To change the cadence, start top -d 1 for one-second updates or htop -d 5 for a slower five-second refresh.
A fresh top screen opens with four stacked lines before the process list begins:
top - up 4:15,  1 user,  load average: 0.72, 0.65, 0.58
Tasks: 214 total,   1 running, 212 sleeping,   0 stopped,   1 zombie
%Cpu(s):  4.1 us,  1.2 sy,  0.0 ni, 94.3 id,  0.4 wa,  0.0 hi,  0.0 si,  0.0 st
MiB Mem :  16021.2 total,   4183.0 free,   2271.5 used,   9566.7 buff/cache
MiB Swap:   2048.0 total,   2048.0 free,      0.0 used.  9014.1 avail Mem
The first line is uptime plus load average: time the machine has been up, how many sessions are attached, and the one, five and fifteen minute load figures. The Tasks line counts process states. The %Cpu(s) line splits CPU time into buckets. The Mem and Swap lines report memory, and avail Mem is the number that actually matters.
htop shows the same four things in a different shape: a load average line, then one bar per CPU core, then a memory gauge and a swap gauge, then the process list. Reading its meters left to right in one sweep is faster than parsing text, and the per-core bars immediately reveal a single hot core that the aggregate line hides.
2. Read CPU percentages and load average correctly
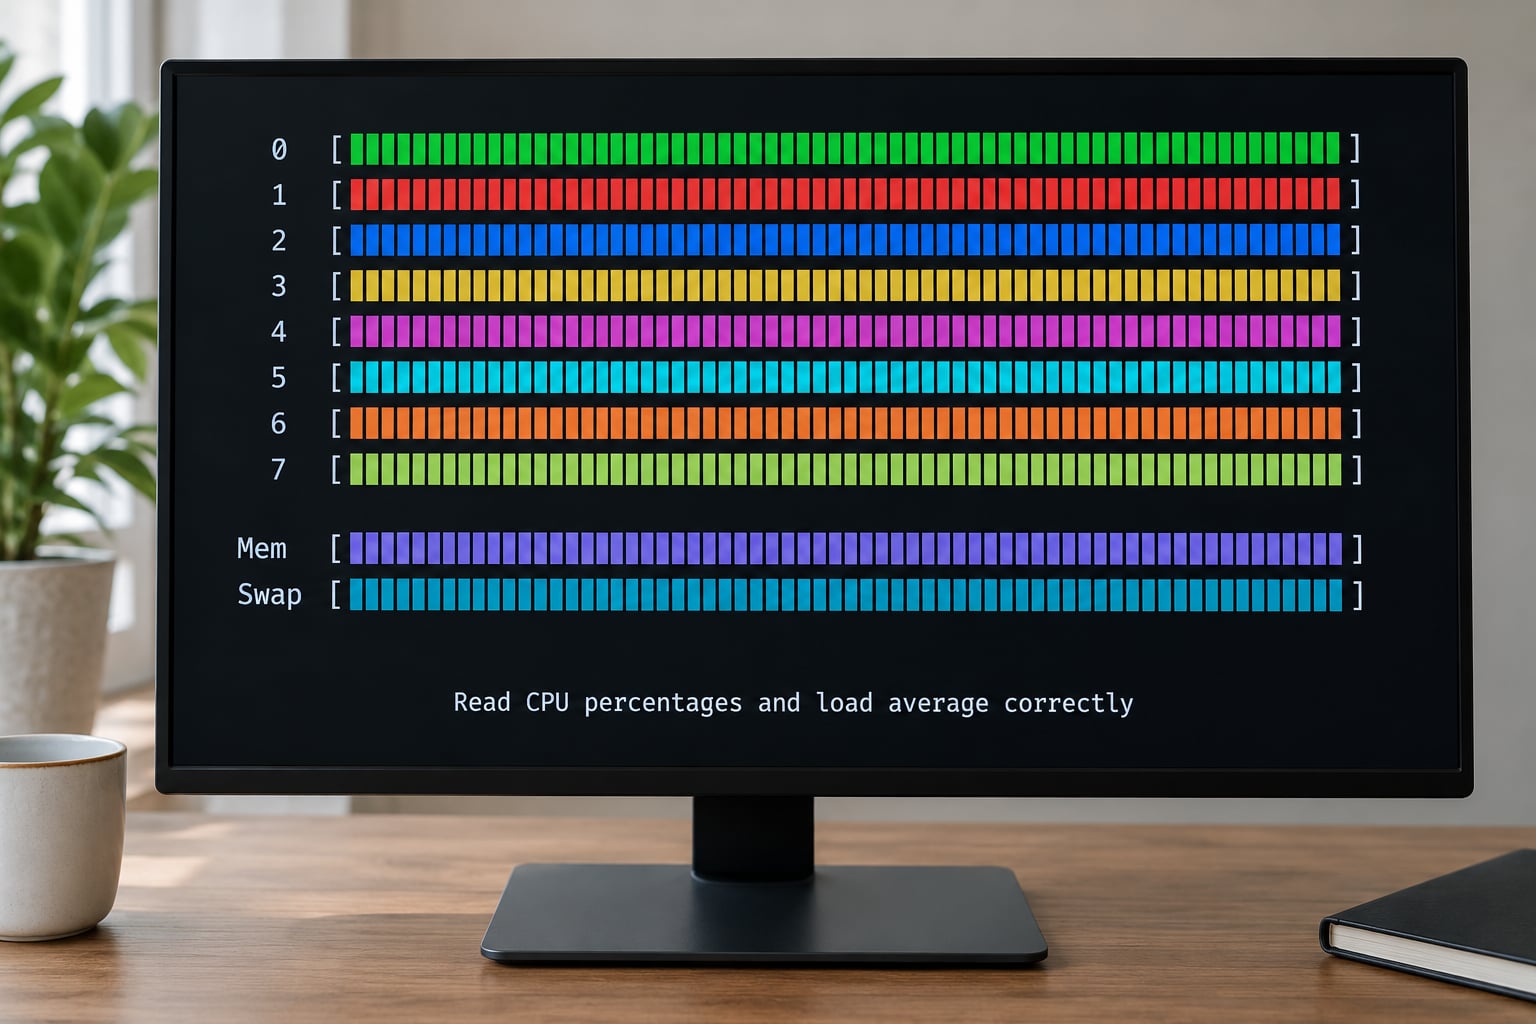
The %Cpu(s) line is eight percentages of total CPU time, and they add up to roughly 100:
| Field | Name | What it means |
|---|---|---|
| us | User space | Time in your programs, libraries and applications. |
| sy | System | Time in the kernel: syscalls, memory management, device drivers. |
| ni | Nice | User time from processes running at a raised nice value. |
| id | Idle | Nothing to do. On an idle server this should sit near 100. |
| wa | I/O wait | CPU free but stalled waiting on disk or storage. This is the one people miss. |
| hi | Hardware interrupt | Time servicing interrupts from devices such as network cards. |
| si | Software interrupt | Time in kernel softirq handling, often network and disk processing. |
| st | Steal time | Time the hypervisor took away. On a busy VPS this is normal; if it is high and steady, the host is oversubscribed. |
Load average is a different measurement, and mixing it up with CPU is the most common error. It is a smoothed average of how many tasks were runnable or waiting on uninterruptible I/O over the last minute, five minutes and fifteen minutes. A load of 4.0 on a 16-core box is quiet; a load of 4.0 on a 2-core VPS is a queue forming.
Get your baseline with nproc. Then treat a sustained load at or above the core count as saturated, and treat a load above the core count as a real problem. The gaps between the three numbers tell you the direction: a 1-minute figure far above the 15-minute figure means a spike just started, while the opposite means things are settling down.
Now the point that trips up nearly everyone: why does one process show 158% CPU? Because the %CPU column in the process table is measured against a single core, while the %Cpu(s) summary line is the whole machine. On an 8-core box a threaded process that saturates everything reads 800% in the process table and the summary line reads near 0% idle. Both are correct. They are just denominated differently, and adding up the process column will never match the summary.
The flip side: if one core reads 100% and no process in the list looks busy, the time is going to threads or interrupts. Press H in top to show threads, or shift + H in htop.
3. Understand memory, cache, and swap figures
The Mem line has four numbers that behave differently. total is installed RAM. used is memory held by processes. buff/cache is the kernel’s file cache plus buffers, and it is not wasted: it gets reclaimed the moment an application asks for it. avail Mem is the honest answer to “how much could a new process still get?” without forcing a cache flush.
Low free with healthy avail is the normal steady state of a Linux server. Servers on the Proxmox and TrueNAS forums routinely post a nearly full htop memory bar and panic about the OOM killer; the segment causing the alarm is almost always cache, which the kernel reclaims on demand. Read the avail value, or run free -h for the same numbers in friendlier units.
In htop the memory gauge is colour-coded. Green is memory in use, the yellow-brown segment is cache, and what is left is free. Watch the yellow section shrink while green climbs; that is a leak. Watch swap used climb and stay there under normal load; that is memory pressure, and the box will feel slow even when CPU is idle.
On the process side, three columns matter and they are constantly misread:
- VIRT is total virtual address space the process has reserved. A database or JVM reserves enormous address space it never touches, so a huge VIRT is not alarming on its own.
- RES is resident set size: the memory actually in RAM right now. This is the number that tracks real pressure and the one to watch for growth over time.
- SHR is the shared subset, used by threads and libraries mapped by several processes. It is included in RES, not added on top.
A memory leak looks like one process whose RES climbs steadily over an hour while everything else stays flat. htop‘s F6 sort on RES makes that obvious in seconds.
4. Inspect the process table and decode every column
Below the summary, the sorted process list is the part you will actually act on. Most sessions default to sorting by CPU, which hides memory problems until they turn into an outage.
| Column | Meaning | What to look for |
|---|---|---|
| PID | Process ID | The number you feed to kill, strace or ls -l /proc/PID. |
| USER | Owner | Anything you do not recognise under root deserves a look. |
| PR | Priority | Scheduling weight. Lower numbers get the CPU first. |
| NI | Nice value | -20 is the most favourable, 19 the least. Positive values were how you deprioritise a backup job. |
| VIRT | Virtual size | Reserved address space, including unused reservations. |
| RES | Resident size | Real RAM in use. Watch this one for leaks. |
| SHR | Shared memory | Subset of RES shared with other processes. |
| S | Process state | One letter. Decoded in the table below. |
| %CPU | CPU share | Per-core, so it can exceed 100% on a multicore machine. |
| %MEM | Memory share | Percentage of total RAM held by this process. |
| TIME+ | Cumulative CPU time | The only column that is a running total, not a recent rate. It also shows threads and the leading letter of the state. |
| COMMAND | Command line | Run top -c to see full arguments, which is how you spot a miner disguised as a system service. |
The state column gets listed by every tutorial and decoded by almost none, so here it is:
| Code | State | Meaning |
|---|---|---|
| R | Running | On a CPU or in the run queue right now. Many R processes on a small machine is the load average story. |
| S | Sleeping | Idle, waiting for an event. Most processes are S most of the time and that is fine. |
| D | Uninterruptible sleep | Blocked on kernel I/O such as a disk read. A growing pile of D processes with idle CPU is the classic “the disk is the problem” signature. |
| Z | Zombie | Finished, but the parent never reaped it. It consumes only a PID slot. More than a handful means a buggy service. |
| T | Stopped | Halted by SIGSTOP, usually after you hit ctrl + z in a shell. |
| t | Tracing | Stopped or being stepped by a debugger such as strace. |
S and D are the pair worth learning. A process in S is waiting politely for input. A process in D is waiting for the storage layer to answer, and nothing you press will make it hurry.
5. Use sorting, search, and display controls
Both tools cover the same jobs, just with different keys. In htop most of it is function keys and a mouse; in top it is single letters you have to remember.
| Task | top | htop |
|---|---|---|
| Sort by CPU or memory | P / M, or launch with top -o %MEM | F6 and pick the column |
| Search for a process | No direct search; use u to filter by user | F3, type part of the name, hit Enter |
| Filter | u (user), f for field conditions | F4 filter dialog |
| Kill a process | k, then the PID, then the signal | F9 with the row highlighted |
| Change priority | r | F7 nice, F8 renice |
| Tree view | not available | t |
| Per-core CPU view | 1 | On by default as the per-core bars |
| Show threads | H | Right-click a process, or toggle in the setup screen |
| Full command line | c | Shown in the command column by default |
| Settings / save config | W writes ~/.toprc | F2 setup, saved to ~/.config/htop/htoprc |
| Quit | q | F10 or q |
Tree view is the feature that settles the “one app is using 25% CPU with no traffic” question that keeps coming up on the Plesk and Cloudron forums. A single application spawning workers looks like one line; press t and you see which child is spinning.
For scripts and snapshots, top has a batch mode that prints and exits instead of drawing a live screen:
top -b -n 1 > snapshot.txt
top -b -n 3 -d 2 -o %MEM > memory-watch.txt
That is the reliable way to capture output for a report, a ticket or a diff against a later snapshot. Newer htop builds also accept -b for batch output, but check htop --help on your version before you depend on it.
6. Correlate the metrics and troubleshoot a slow system
Here is the part that actually resolves incidents: pair the signals instead of reacting to one line. Load alone is ambiguous, and so is CPU alone.
| Symptom | What it usually means | Next check |
|---|---|---|
| High load, CPU mostly idle | Tasks are waiting on storage or the network, not on compute | Look at wa and count processes in D state with ps -eo stat,comm | grep '^D' |
| One core at 100%, no hot process | A single thread or an interrupt storm | Toggle threads with H, check hi and si values |
| Memory bar nearly full, yellow dominant | Cache, which is reclaimable | Read avail Mem or free -h before doing anything |
| Swap used and climbing, system slow | Memory pressure, pages moving to disk | Sort by RES, find the top consumer, then vmstat 1 to watch si and so |
| Process %CPU above 100% | Normal for threaded work on multiple cores | Divide by core count to get the machine share |
st steadily above a few percent | The cloud host is oversubscribed | Nothing to fix locally; consider a larger or quieter instance type |
My triage order, when a server feels slow and I have about thirty seconds:
- Read the uptime line. Is load above the core count from
nproc? - Read
%Cpu(s). Isidnear zero, or iswahigh? - Read
avail Memand swap used. Ignore the free number. - Sort the process table by CPU, then by memory, and look at RES growth rather than a single snapshot.
- Only then decide what to touch, and check the PID’s owner with
ps -fp PIDbefore sending any signal.
When you do act, send SIGTERM first. It asks the process to shut down cleanly and flush state. Reach for SIGKILL only when the process ignores SIGTERM, and treat renicing a production process as a last resort since it changes how the whole scheduler treats that workload.
Common Mistakes to Avoid
- Treating load average as CPU usage. Load counts runnable and uninterruptible tasks. It can be 8 with an idle CPU if everything is blocked on a slow disk. Fix: always read
%Cpu(s)before you draw a conclusion from load. - Panicking about low free memory. A server with 200 MB free and 12 GB of cache is healthy. Fix: read
availin the top summary or runfree -h. - Comparing a one-second sample to an average. Every number except TIME+ is a rate over the refresh interval, so a single glance catches peaks and noise. Fix: watch for at least ten seconds, or raise the interval with
htop -d 5. - Ignoring I/O wait.
waabove a few percent with idle CPU is the storage layer telling you it is the bottleneck, and no amount of killing CPU processes will help. Fix: check for D-state processes and move toiostat -x 1. - Killing a process without checking who owns it. A PIDs list does not tell you that PID 4821 is your database and not the init process of a container. Fix: run
ps -fp PIDand read the full command withtop -cfirst. - Reaching for
kill -9by habit. A killed process gets no chance to close sockets or flush writes. Fix:SIGTERMfirst, confirm the PID,SIGKILLsecond. - Expecting one tool to answer everything. Neither
topnorhtopshows network bandwidth or disk queue depth. Fix: usevmstat 1,iostat -x 1,pidstat -d 1andsarfor history once you know where to look. - Using a container view as if it were the host. Inside Docker or a VM, CPU limits from cgroups mean your view can look idle while the host is saturated, and steal time tells you what the hypervisor is doing. Fix: check the cgroup quota before concluding the workload is small.
Frequently Asked Questions
How to interpret top command output?
Read top output in four blocks, top to bottom. The uptime line gives time online, user count and the 1, 5 and 15 minute load averages. The Tasks line counts running, sleeping, stopped and zombie processes. The %Cpu(s) line splits CPU time into user, system, idle, iowait and steal. The Mem and Swap lines report memory, then the process table ranks processes by CPU or memory.
How is htop different from top?
htop shows the same kernel data as top, drawn as color-coded per-core CPU meters instead of one text line, and it adds mouse support, a process tree view, search and filter dialogs, and horizontally scrollable columns. top is part of every base system and offers a batch mode for scripts. htop is a separate package you install, and it saves its settings to its own config file.
What does %CPU in top mean?
The %CPU column is a per-process share of a single CPU core, measured across the last refresh interval, so a threaded process can legitimately show more than 100% on a multi-core box: 800% means it saturated all eight cores. The %Cpu(s) line at the top is different, it is the whole-machine aggregate and normally adds up to about 100%. Never expect the process column to sum to the summary.
How much load average is too much in Linux?
Compare it to your core count, not to 1.00. Run nproc to see how many cores you have, then treat a sustained load at or above that number as saturated. A load of 6 on a 16-core machine is quiet, while a load of 6 on a 2-core VPS is a real queue. Watch the gap between the 1, 5 and 15 minute values too, since a 1-minute figure far above the 15-minute one means a fresh spike.
How do I kill a process in htop?
Highlight the row with the arrow keys or the mouse, press F9, choose the signal, and confirm. Use SIGTERM wherever possible, since it asks the process to exit cleanly and flush its writes. Save SIGKILL for processes that ignore SIGTERM. Before you confirm, check the PID and owner with top or ps so you do not kill the wrong service, then watch the load average settle.
Conclusion
Reading top and htop output is a fixed order, and the order is what makes it fast. Read the summary header first: uptime and load average against your core count, then %Cpu(s) to see whether the CPU, the disk or neither is busy, then avail Mem and swap rather than the free figure, and only then the process table.
Before you change anything, sort by CPU and then by memory, check who owns the PID, and watch the top process for ten seconds instead of trusting a single frame. That single habit, plus the rule that a per-process 158% is normal on a multicore box, covers most of what people get wrong when a Linux machine feels slow.