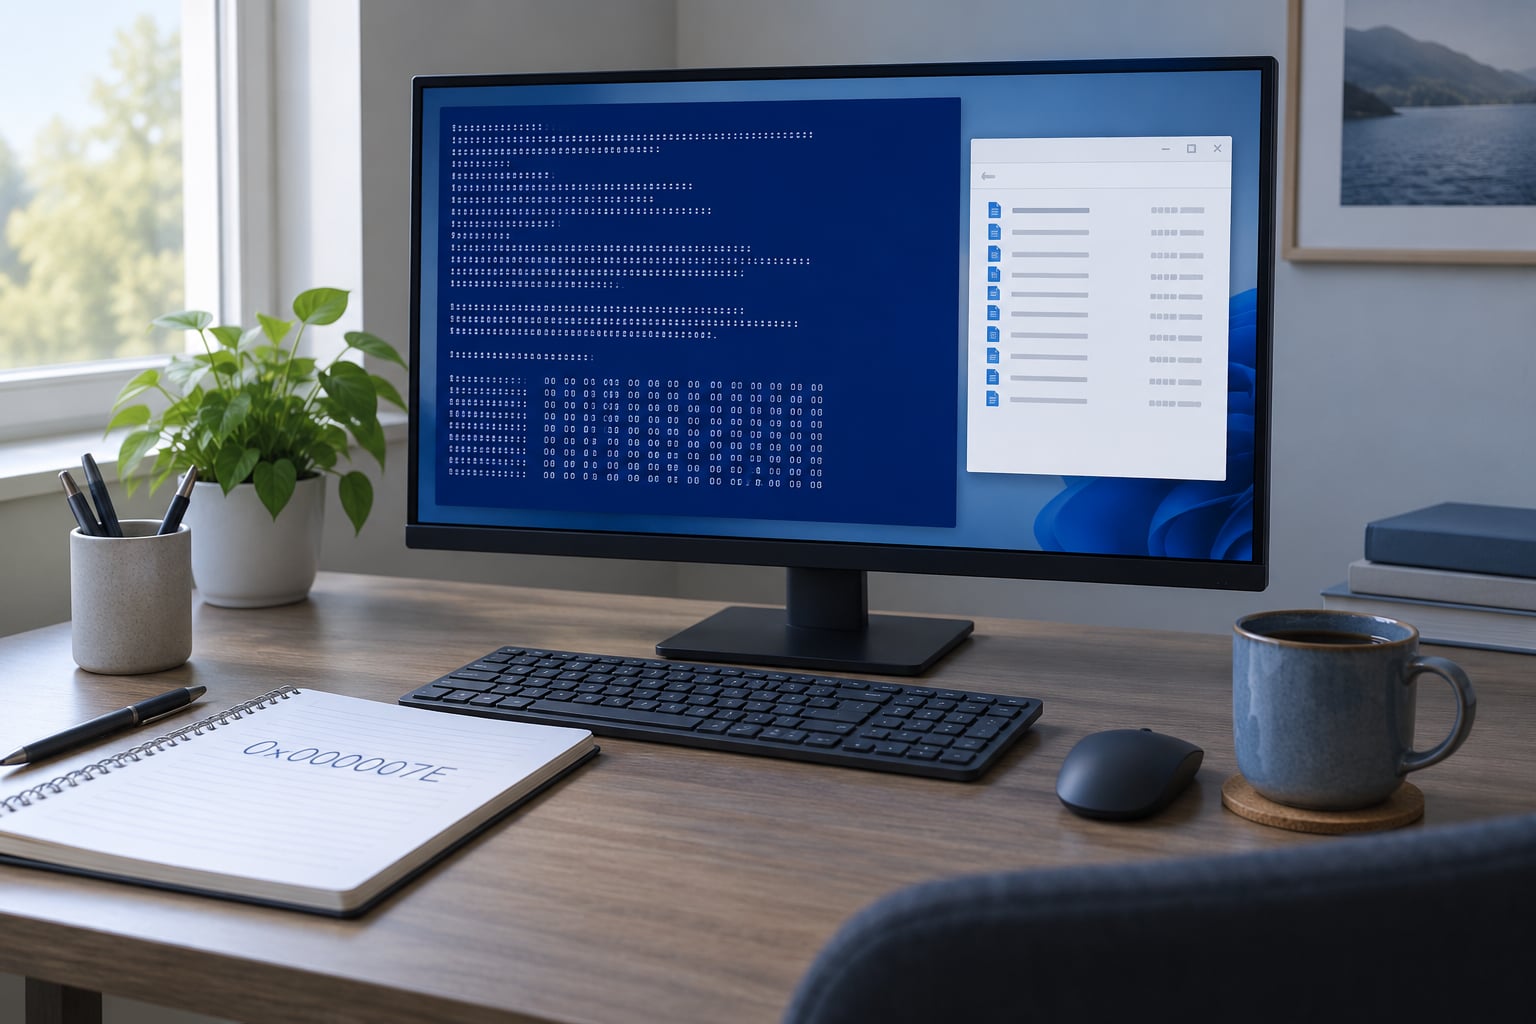
A blue screen is Windows hitting a fault it cannot recover from, so it halts to keep your files from being corrupted and shows a stop code. To debug a Windows blue screen you work one loop: stop the automatic restart, read the stop code, confirm Windows is writing crash dumps, open the dump in WinDbg with symbols configured, run !analyze -v, then fix whatever the output points at.
For most recurring crashes the loop takes 30 to 60 minutes, and the evidence beats guesswork. If you just want your PC back today, work Steps 1 to 3 and the fixes in Step 6. If you want the named driver behind the crash, read Step 4 as well.
Table of Contents
- What You Need
- Step-by-Step: How to Debug a Windows Blue Screen
- Step 1: Record the Exact Failure
- Step 2: Check System Reliability and Event Viewer
- Step 3: Enable and Locate Crash Dumps
- Step 4: Analyze the Dump in WinDbg
- Step 5: Test Drivers, Hardware, and System Files
- Step 6: Apply the Fix and Confirm the Result
- Common Mistakes
- Frequently Asked Questions
- Does the blue screen stop code tell me exactly which part is broken?
- What is the easiest way to debug a Windows blue screen?
- Can I analyze a Windows crash dump without WinDbg?
- Why is no minidump file created after my blue screen?
- How do I know whether a driver or hardware device caused the crash?
- When should I reinstall Windows after repeated blue screens?
- Conclusion
What You Need

Gather these before you change anything. Debugging goes wrong when settings or drivers are altered first and the original evidence disappears.
- Administrator access on the machine that crashed, or on a spare machine if the crashed one no longer boots.
- The stop code and the trigger. A photo of the screen beats a memory of it.
- Dump settings turned on so the next crash leaves a .dmp file behind.
- WinDbg, plus a working symbol path pointing at the Microsoft symbol server.
- A restore point or a recent backup if a driver rollback or update is part of the plan.
- A quiet test window where you can reproduce whatever triggers the crash.
WinDbg is free from Microsoft and installs on a healthy PC. You can analyse dumps copied from a broken machine, which is the workflow I prefer when the affected box will not boot.
Step-by-Step: How to Debug a Windows Blue Screen
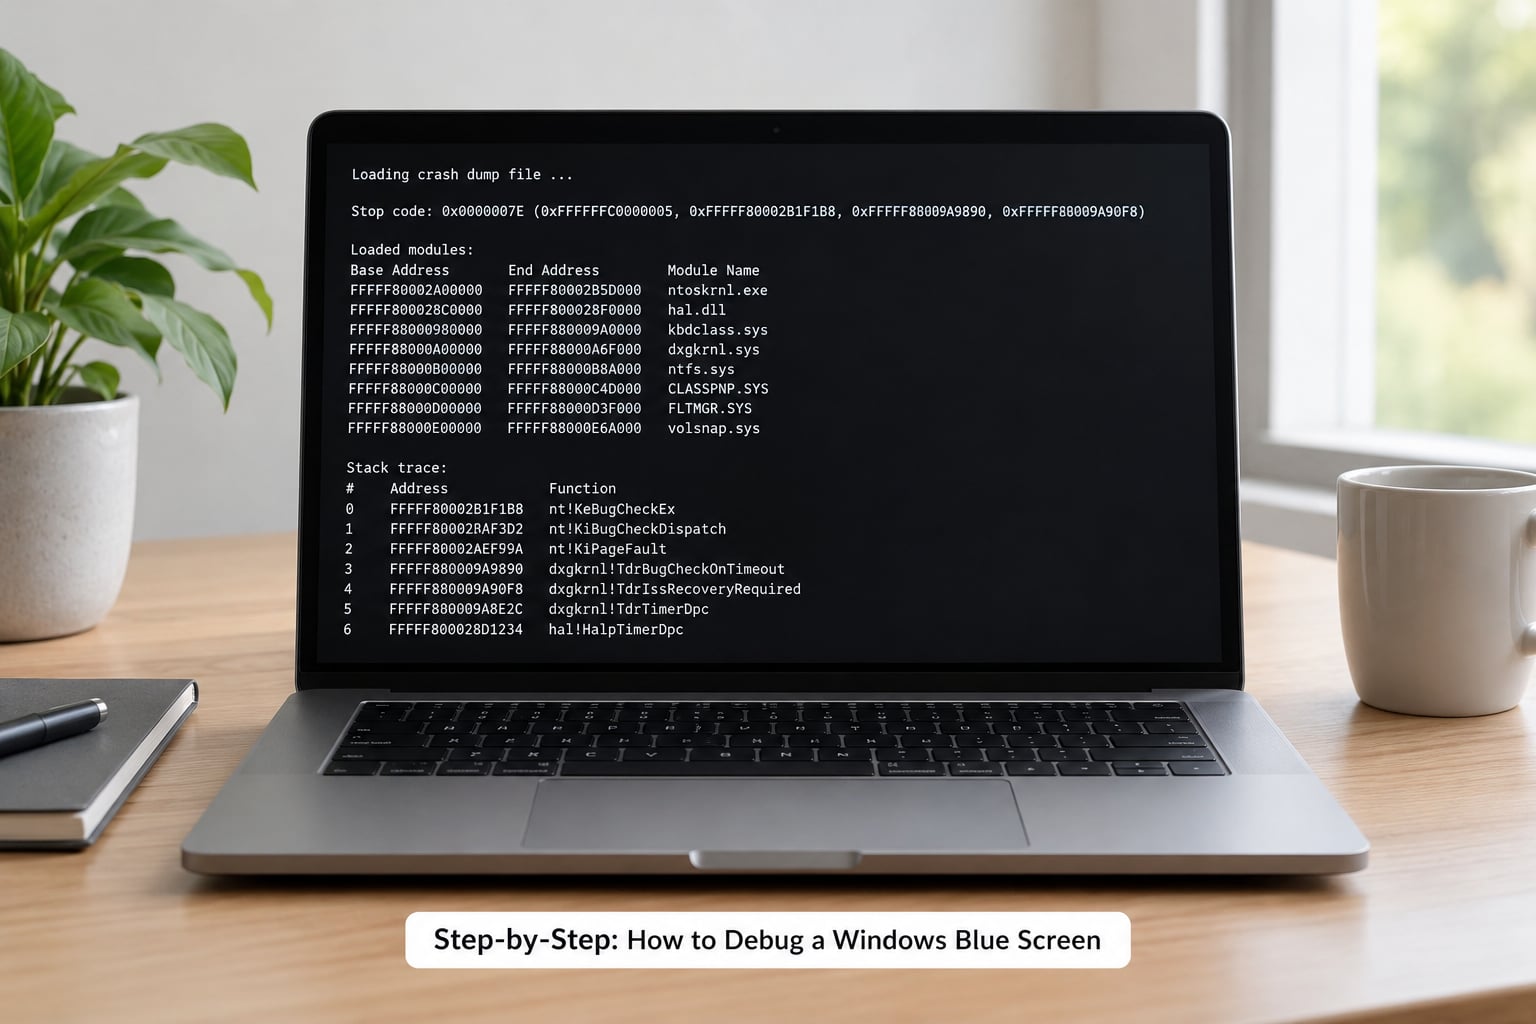
The order below matters. Each step tells you what to do, what a useful result looks like, and when to move on to the next one.
Step 1: Record the Exact Failure
Windows restarts within seconds by default, which is why most people can never read the stop code. Open Run, enter sysdm.cpl, go to Advanced, then Startup and Recovery and Settings, and untick Automatically restart under System failure. On Windows 11 the same pane is reached through Control Panel, not the Settings app.
Now write down four things before the next reboot: the stop code in hex, the affected file line if one is shown, the time of the crash, and what you were doing. Startup, sleep or wake, gaming, networking or ordinary desktop work each point at a different subsystem.
A useful result is a written record you could paste into a support ticket. If you cannot tell whether the crash happens on wake from sleep, say so in your notes and test that case deliberately later.
| Stop code | What it means | Usual cause | First action |
|---|---|---|---|
| MEMORY_MANAGEMENT (0x0000001A) | Memory manager hit a corrupt structure | Failing RAM, bad driver, loose memory | Run Windows Memory Diagnostic, then MemTest86 |
| IRQL_NOT_LESS_OR_EQUAL (0x0000000A) | Kernel memory touched at the wrong interrupt level | Outdated driver, usually chipset or network | Read the faulting module in the dump, then update that vendor’s driver |
| PAGE_FAULT_IN_NONPAGED_AREA (0x00000050) | Bad memory reference outside pageable memory | RAM fault, overheating, aggressive overclock | Return BIOS defaults, then test each memory stick alone |
| CRITICAL_PROCESS_DIED (0x000000EF) | A process the system depends on exited | Corrupt system files, failing drive, loose hardware | Run chkdsk /scan and DISM then sfc /scannow |
| SYSTEM_THREAD_EXCEPTION_NOT_HANDLED (0x0000007E) | Kernel thread hit an unhandled exception | Driver bug, commonly graphics or storage | Check MODULE_NAME, then roll that driver back |
| DPC_WATCHDOG_VIOLATION (0x00000133) | A driver took too long to respond | Storage, network or GPU driver latency | Update storage and chipset drivers before anything else |
| VIDEO_TDR_TIMEOUT_DETECTED (0x00000117) | Graphics driver stopped responding | GPU driver, GPU power or thermals | Clean reinstall the GPU driver, check GPU cable seating |
| 0xC000021A | Fatal system lock, usually a driver deadlock | Recently installed driver or antivirus | Uninstall the newest driver or security suite and retest |
| 0xC0000005 STATUS_ACCESS_VIOLATION | Process accessed memory it does not own | Any driver or app fault; the stop code is generic | Use the dump to find the module, not the code |
| 0x0000003B SYSTEM_SERVICE_EXCEPTION | System service fault during a transition | Corrupted system image or driver | Run DISM /RestoreHealth followed by sfc /scannow |
| 0xC0000145 | A required DLL could not be loaded at startup | Bad update, missing or mismatched file | Uninstall the latest update from Settings, then Startup Repair |
| BUGCODE_USB_DRIVER | USB stack fault, often a double submit | USB DAC, hub, capture card or other peripheral | Disconnect peripherals one at a time and retest |
Step 2: Check System Reliability and Event Viewer
Reliability Monitor (type perfmon /rel) gives you a timeline of crashes, warnings and installs for the last 30 days. The application that sits directly above the crash entry is often the software that caused it. Event Viewer, under Windows Logs, holds the raw records: look for Event ID 41 (unexpected restart), 1001 (BugCheck) and the disk, WHEA or display errors just before it.
A useful result is a named change in the hours before the crash: a Windows update, a GPU or chipset driver, a new peripheral, or an antivirus subscription renewal. If the timeline is empty, move on to dumps rather than guessing.
One recurring signature points to hardware or storage rather than a single driver: crashes spread across unrelated activities, appear after the machine warms up, and survive a Safe Mode boot. A single crash tied to one activity points at that software or its driver.
Step 3: Enable and Locate Crash Dumps
In the same Startup and Recovery dialog from Step 1, set Write debugging information to Small memory dump (256 KB) and tick Overwrite any existing file. Small dumps hold the stack trace, which is what you need, and they keep only the most recent crashes.
A useful result is one of two things. With small dumps you get numbered files in C:WindowsMinidump, for example 071026-14328-01.dmp. With an automatic or complete memory dump you get C:WindowsMEMORY.DMP, which holds far more but is written on every crash and can be several gigabytes.
If the folder does not exist, that is normal until the first crash is written. If dumps still do not appear, check that the paging file sits on the system drive and is set to system-managed, and that the drive has free space. You can confirm both in the same dialog under Virtual memory and by viewing hidden and system folders in File Explorer.
Step 4: Analyze the Dump in WinDbg
Install WinDbg from the Microsoft Store, or use the WinDbg Classic build that ships with the Windows SDK (search the Store or run winget search windbg to find the current package). Both are free. Older tutorials still point at the retired SDK download page and the old msdl symbol URL, which is where most people get stuck today.
Open File, Open Crash Dump, pick the .dmp file, and set the symbol path with Ctrl+Alt+S in the modern build (File, Symbol File Path in Classic). Symbols are the name lookup tables that turn raw memory addresses into readable function names, and without them the output is a wall of hex.
srv*C:symbols*https://msdl.microsoft.com/download/symbolsA useful result is the first symbol download scrolling past the console, followed by the kd> prompt. Type !analyze -v and press Enter. Downloading symbols for the first dump can take a few minutes; later dumps of the same machine are fast because the cache is already local.
Read the output field by field. BUGCHECK gives the code. MODULE_NAME or IMAGE_NAME gives the driver file, which is the line most people want. PROCESS_NAME shows the process involved. FAILURE_BUCKET_ID is the signature you quote when searching or filing a report. STACK_TEXT is the call path, and CURRENT_IRQL hints at interrupt-related faults.
If the module name ends in .sys and Windows symbols load for it, you are close. If the output says symbols could not be loaded for a third-party driver, the name alone still points at the software that installed it. Useful follow-up commands: lm for loaded modules, lmvm nvlddmkm for one module’s details, kv for the stack, !thread for the faulting thread and .symfix to reset the symbol path.
Step 5: Test Drivers, Hardware, and System Files
Map the .sys filename to the software that owns it. Search the file name with the vendor name, check the Driver tab in Device Manager properties for the provider and date, or look under Apps for recently installed display, audio, antivirus and virtual network tools. Then update it from the vendor’s own site, or roll it back with Device Manager, Device Properties, Driver, Roll Back Driver if that option is active.
Check the hardware in the same session. Run mdsched.exe for a quick Windows Memory Diagnostic pass, and use MemTest86 for a real answer since it runs several full passes outside Windows. Test each stick on its own, and check drive health with chkdsk C: /scan plus the SMART status your drive exposes in PowerShell or a vendor tool. Bad RAM produces nearly any stop code you can name, which is why it is tested before you blame a driver.
Check the system files too. Run DISM /Online /Cleanup-Image /RestoreHealth first, then sfc /scannow, because SFC repairs what DISM restores. After each step, use the machine normally for a while before starting the next; changing five things at once is how a diagnosis gets lost.
Skip third-party driver updater utilities and online dump analyzer sites. The updaters install drivers nobody asked for, and upload sites take a file that maps out your system.
Step 6: Apply the Fix and Confirm the Result
Apply the fix that matches the evidence: roll back or update the named driver, uninstall the update listed in Reliability history, disconnect the peripheral that triggers it, run one antivirus product instead of two, or return BIOS overclock and undervolt settings to stock. If the dump named a generic module and the crash still happens, Driver Verifier (verifier.exe) stresses every driver to surface the faulty one, and it will deliberately crash the machine, so undo it from Safe Mode by running the same tool and choosing Remove All.
Confirm the result over a real verification period, not five minutes. Reproduce whatever triggered the crash: play the same game for an hour, run the same sleep and wake cycle, dock and undock the laptop. Then check Event Viewer for new critical errors and compare the timestamps of new dump files against your old ones.
Keep the change if the crash stops. Roll back if the frequency changed or a new stop code appeared, because that means you traded one fault for another. If the crash survives a clean boot, a Driver Verifier pass, a memory test and a storage check, the evidence points at the board, the CPU or the drive, and hardware replacement becomes the sensible next step.
Common Mistakes
- Analyzing the wrong dump. Several crash files sit in the folder and the newest is not always the one you care about. Sort by date and match the file timestamp to the crash time you wrote down in Step 1.
- Skipping symbols. Raw hex addresses are what an unset symbol path produces, not a failed analysis. Set the path once with
.symfixand reload. - Trusting the file named on the screen. The affected file line is often the victim, not the cause. The faulting module in the dump is the better lead.
- Updating every driver at once. You lose the ability to tell which change mattered, and you may replace the only stable driver set you had.
- Rolling back a driver that was never updated. Roll Back Driver only appears when a previous version exists, so it is not an answer for a machine that shipped with the driver.
- Deleting the wrong files. WinSxS, the page file and system folders are not cleanup targets. Disabling the page file also disables crash dumps.
- Reinstalling Windows first. It is the advice people most often regret here, because it destroys the evidence and usually leaves the underlying fault in place.
- Testing for five minutes. Intermittent faults come back after days or under specific load. Judge the fix on the trigger, not on the clock.
Before you post to a forum or open a ticket, collect the stop code, the exact time, what changed recently, the dump file itself, and the key lines from !analyze -v. That bundle is what gets a useful answer instead of a guess, and it saves a round of questions.
Frequently Asked Questions
Does the blue screen stop code tell me exactly which part is broken?
No. A stop code names the class of failure, not the component. MEMORY_MANAGEMENT and 0xC0000005 can both come from faulty RAM, a driver, a failing drive or an overheating chip. The code narrows your search, and the crash dump narrows it further, because MODULE_NAME points at the driver involved. Treat the code as a starting filter and the dump as the evidence.
What is the easiest way to debug a Windows blue screen?
Turn off Automatically restart first, so the stop code stays on screen, then work backwards through your recent changes: Windows updates, new drivers, new peripherals, new security software. That alone resolves a large share of recurring crashes. If it does not, enable small memory dumps and read the faulting module in WinDbg before touching anything else.
Can I analyze a Windows crash dump without WinDbg?
Partly. Reliability Monitor and Event Viewer will tell you what crashed and which hardware errors came before it, but they cannot read the stack inside the dump file. WinDbg is free from Microsoft and does that job properly. If you cannot install it, copy the .dmp to a healthy PC and open it there, rather than uploading the file to an unknown online analyzer.
Why is no minidump file created after my blue screen?
Check four things in order: dump writing is set to Small memory dump under Startup and Recovery, the page file is on the system drive and system-managed, the system drive has free space, and the crash is reaching Windows rather than a hard power loss. If the machine cuts to black with no screen at all, no dump is written because nothing survived to write it.
How do I know whether a driver or hardware device caused the crash?
Boot into Safe Mode with Networking and use the machine normally. If the crashes vanish, suspect software, drivers or startup services. If they continue, suspect RAM, storage or thermals. A trigger-specific crash points at software, while crashes that follow the machine warming up, appear across unrelated tasks or follow a cold boot point at hardware. Test memory before you replace anything.
When should I reinstall Windows after repeated blue screens?
Only after the evidence has run out. By the time you reinstall, you should have a clean Driver Verifier pass, a clean MemTest86 run, healthy storage, and repaired system files from DISM and sfc. If the crash survives all of that, a clean install is worth testing, because it separates software state from hardware fault. Reinstalling earlier usually destroys the evidence and changes nothing.
Conclusion
Start with three actions: turn off Automatically restart and write down the stop code, check Reliability Monitor and Event Viewer for what changed before the crash, then analyse a freshly generated dump in WinDbg with !analyze -v.
From there, change one likely cause at a time and use the evidence to pick the next one. Roll back a named driver, uninstall a suspect update, disconnect a peripheral, test the memory, repair the system files. That loop is how to debug a Windows blue screen without spending a week on changes that prove nothing.