
If you have ever stared at an uptime line and wondered what the three numbers actually mean, you are not alone. Load average explained in Linux is simpler than most tutorials make it sound: it is a smoothed count of tasks competing for your attention, reported over one, five, and fifteen minutes. Here is how the kernel builds that number and how to turn it into a diagnosis.
One thing to clear up before we go further: load average is not a CPU percentage. That single misconception causes most of the confusion I see on server forums, so the article spends real time separating the two.
Table of Contents
- What Does Load Average Mean in Linux?
- How Linux Calculates Load Average
- How to Read the 1-Minute, 5-Minute, and 15-Minute Values
- Is Load Average the Same as CPU Usage?
- How Many Load Average Values Are Too High?
- What Counts Toward Linux Load Average?
- Why Can Load Average Rise Even When the CPU Is Idle?
- How to Check Load Average and Diagnose the System
- Frequently Asked Questions
- Is a Linux load average of 1 always bad?
- Why is my load average high when CPU usage is low?
- Should I divide Linux load average by the number of CPU cores?
- Why does load average stay high after the server becomes idle?
- How should load average be monitored inside a Docker container?
- Conclusion
What Does Load Average Mean in Linux?
Load average in Linux is the exponentially damped moving average of the number of tasks that are running or in uninterruptible sleep, averaged over one, five, and fifteen minutes. It describes how much work was competing for the CPU and the disk, and how that pressure is trending. It is a count of tasks over time, not a percentage of processor capacity.
Two kernel process states feed the number, and both matter:
- Runnable (R) means the task is awake and ready to run but the scheduler has not given it a CPU yet. These are the tasks actively waiting in the run queue.
- Uninterruptible sleep (D) means the task is waiting on something it cannot be interrupted out of, almost always an I/O request against a disk or a network filesystem. A process in D state is counted even though it burns no CPU at all.
Because D state counts, load average tells you about storage and network stalls that a CPU meter will completely hide. That is the whole reason it is worth understanding.
How Linux Calculates Load Average
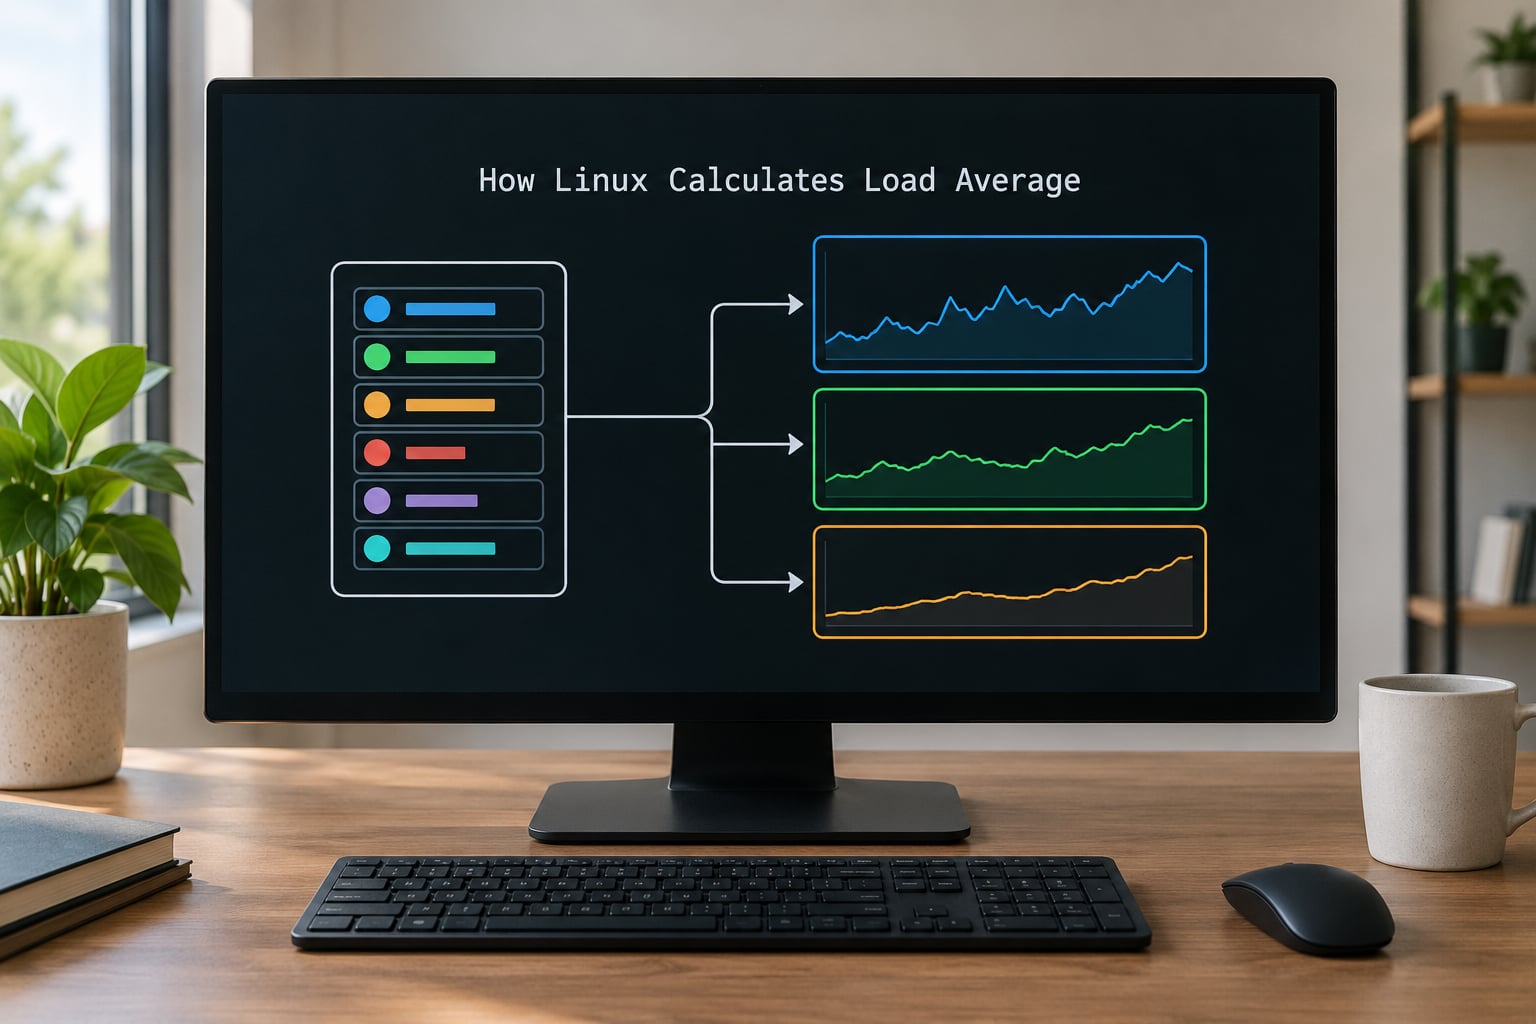
The kernel keeps the count in /proc/loadavg. The accounting runs on a fixed schedule: the scheduler samples the combined count of runnable and uninterruptible tasks on a five-second tick, then folds each sample into three separate decay chains.
What you actually read is three exponentially damped moving averages. In the kernel source these are the EXP_1, EXP_5, and EXP_15 decay constants, applied on top of a fixed-point scale called FS_AVERAGE, which has the value 11. The averages are kept in fixed-point integers and only converted to decimal when the kernel formats them for /proc/loadavg. Robert Walker’s 2006 Linux Journal paper, Examining Load Average, walks through this derivation in full and is still the best reference on it.
| Reported value | Decay constant | What it responds to |
|---|---|---|
| 1-minute | EXP_1 | Almost entirely the last few seconds of work |
| 5-minute | EXP_5 | Recent minutes, with earlier samples fading fast |
| 15-minute | EXP_15 | Sustained pressure over a quarter of an hour |
Here is the shape of it in plain terms:
  tasks in R (runnable)
  tasks in D (D-state)   /--> sampled every 5s --> EWMA (EXP_1)  --> 1-minute value
                                                   EWMA (EXP_5)  --> 5-minute value
                                                   EWMA (EXP_15) --> 15-minute value
That same raw file has three fields beyond the averages:
$ cat /proc/loadavg
0.52 0.74 0.61 2/1183 14402
The fourth field is 2/1183: two currently runnable tasks out of 1183 total schedulable entities on the system. That last entity is worth pausing on. Since Linux 2.6, the scheduler treats threads as the schedulable unit, so load average counts threads, not processes. A single Java process with forty threads can put forty tasks into the run queue on its own.
Runnability also depends on affinity. A task pinned to one CPU by taskset or a cgroup CPU affinity mask is runnable with respect to the system but can still wait for its CPU while other cores sit idle.
How to Read the 1-Minute, 5-Minute, and 15-Minute Values
Read the three numbers as a slope, not as three separate scores. The 1-minute value reacts fastest and tells you what is happening right now. The 15-minute value is history, and it is the one that tells you whether you have a real problem or a momentary event.
Three patterns cover almost everything you will see in practice.
Rising. The 1-minute is above the 5-minute, which is above the 15-minute. Work is arriving faster than the machine clears it, and the backlog is building right now. A 1-minute of 4.20 with a 5-minute of 2.10 and a 15-minute of 0.90 means roughly four tasks have been runnable over the last minute, against a recent average near two. Pressure is climbing.
Falling. The order reverses: 1-minute of 0.30, 5-minute of 1.90, 15-minute of 4.40. The burst is over and the machine is draining the queue. This is what recovery looks like, and it is exactly what people see after killing a runaway job.
Steady. All three within a narrow band, say 2.05, 2.10, 2.02. The system is carrying a consistent load, which is usually the healthiest state for a busy server. A flat line with a high value means a permanently overloaded box; a flat line near zero means idle.
Watch for the sawtooth too: a 1-minute that spikes and decays on a regular cycle usually means a cron job or a batch process, and the 15-minute value is a good place to see how much of those spikes actually matter.
Is Load Average the Same as CPU Usage?
No, and they can disagree in both directions at the same time. CPU utilization answers “how busy were the processors,” while load average answers “how much work was queued or stalled.” Neither implies the other.
| Aspect | Load average | CPU utilization |
|---|---|---|
| What it measures | Runnable plus uninterruptible tasks | Time the CPUs spent executing work |
| Unit | Task count, an average over time | Percentage of total CPU time |
| Range | No fixed maximum | 0 to 100 percent |
| Includes I/O wait | Yes, via D state | No, iowait is counted separately |
| High value with low CPU time | Normal when storage or network is the bottleneck | Expected, CPU was not the constraint |
| Low value with high CPU time | Normal for a few busy tasks spread across many cores | Expected, work was absorbed instantly |
Concrete case one. A database on a spinning-disk box shows load 12 with CPUs near 5 percent. Queries are sitting in D state waiting on disk seeks, and the storage is the wall. Nothing is wrong with the processors.
Concrete case two. A 64-core machine runs one CPU-bound render job at 100 percent on one core, and load reads 1.00. One task was runnable, it got a core immediately, and the queue never built. Low load, high CPU utilization, healthy system.
How Many Load Average Values Are Too High?
The meaningful threshold is not a number, it is a ratio: compare load against the number of CPUs that can actually run tasks. Sustained load at or above your runnable CPU capacity means tasks are waiting.
| Cores | Comfortable 1-min load | Queue building | Sustained backlog |
|---|---|---|---|
| 1 | Below 0.70 | 0.70 to 1.00 | Above 1.00 |
| 2 | Below 1.40 | 1.40 to 2.00 | Above 2.00 |
| 4 | Below 2.80 | 2.80 to 4.00 | Above 4.00 |
| 8 | Below 5.60 | 5.60 to 8.00 | Above 8.00 |
| 16 | Below 11.20 | 11.20 to 16.00 | Above 16.00 |
That is why a fixed alert threshold is a bad idea. “Page me above load 4” fires constantly on a 2-core VM and never fires on a 64-core host. Relative rules scale; absolute numbers do not.
Two qualifications matter before you build alerts. First, baseline beats rule of thumb. A machine that normally sits at 3.0 on 8 cores may be healthy, and a jump to 5.0 matters more than 4.0 on a box that normally sits at 0.2. Second, use duration windows: alert on the 5-minute or 15-minute value sustained for several minutes, so short bursts do not page you.
What Counts Toward Linux Load Average?
The rule is precise, and precision matters here. Two categories count: tasks in the runnable state, and tasks in uninterruptible sleep. Everything else does not.
A thread actively computing counts. It is runnable or running, and it sits in the queue whenever it is not currently on a CPU. A thread doing a disk read usually does not count, because most ordinary I/O waits are interruptible sleep. That process sleeps in state S, can be woken, and stays out of the load number entirely.
A thread blocked on an uninterruptible wait does count. Kernel-side I/O that has not yet returned a result puts the task in D state, and D state is in the average. This is why a machine can show load 8 with a fully idle CPU: eight tasks are all sitting in D waiting for a device that is not answering.
Threads count individually. Fifty threads inside one process are fifty schedulable entities, so process count tells you very little about load. Program count is only visible in the fourth field of /proc/loadavg.
Why Can Load Average Rise Even When the CPU Is Idle?
This is the question that brings the most people to forums, and the answer is almost always one of five things.
Uninterruptible sleep on slow storage. Tasks pile into D state when a disk is failing or saturated. Look at %wa in top or the wa column in vmstat. Sustained values above 10 percent tell you the storage is the constraint.
Hung network mounts. An NFS or CIFS mount that stops responding holds its processes in D state until the kernel gives up, often after a long TCP timeout. This is the single most common cause of a load average that climbs to absurd numbers and then, mysteriously, returns to normal after a reboot. Rebooting drops the mount and clears the stuck tasks; it does not fix whatever broke the mount. On NAS appliances this is endemic, and users regularly report a dashboard showing idle while uptime prints large numbers.
Softirq pressure. Network receive traffic is processed outside normal process context in kernel softirqs. Heavy inbound traffic can push run-queue depth up while the %si column shows where the cycles went.
CPU throttling and affinity. A cgroup CPU quota pauses tasks once they exhaust their slice within each period. Tasks are runnable while throttled, so load climbs while utilization looks modest. CPU affinity pinning does something similar on a smaller scale.
Steal time on a virtual machine. On shared vCPUs, the hypervisor can take CPU away from your guest. Those cycles show as %st in vmstat, and tasks stay runnable while waiting for a hypervisor slice to come back. A load climb on a VM with an otherwise idle guest is worth checking for steal before anything else.
How to Check Load Average and Diagnose the System
Here is the sequence I use. Command syntax and output columns vary a little between distributions, especially for cgroup paths, so read the man page on your system if something looks different.
- Read the headline. Run
uptimeorcat /proc/loadavg, and runnprocso you have the core count in front of you. Divide the 1-minute value by that count mentally. That ratio is your first verdict. - Check the CPU line. In
toppress1for per-core view, or runhtop. Note%us,%sy,%wa,%si,%st, and%id. Highwameans storage. Highstmeans hypervisor. Highsimeans softirq. - Sample the scheduler. Run
vmstat 1 10. Thercolumn is the run queue depth and should not stay above your core count. A highrwith highwapoints at I/O; highrwith highuspoints at genuine CPU saturation. - Hunt for D state. Run
ps -eo state,pid,ppid,comm | grep '^D'. Anything listed there is a task stuck in uninterruptible sleep and is inflating the average right now. Cross-check mounts withmountordf -hfor a filesystem that refuses to respond. - Look at the disks and per-core balance. Run
iostat -x 1for await and queue depth per device, andmpstat -P ALL 1to see whether all cores are busy or a few are pinned under load.
| Command | What it tells you | Column to read |
|---|---|---|
| uptime | Load 1/5/15 and uptime | First three numbers |
| cat /proc/loadavg | Raw values plus runnable and total entities | Fourth field |
| nproc | Runnable CPU capacity | Single number |
| top | Per-core CPU breakdown and top processes | wa, st, si |
| vmstat 1 | Run queue, context switches, wait queue | r, b, wa, in |
| iostat -x 1 | Per-device latency and queue depth | await, aqu-sz |
| ps -eo state,pid,comm | Which tasks are blocked | STAT column starting with D |
| mpstat -P ALL 1 | Per-core utilization | %usr, %iowait |
On systemd hosts, systemd-cgtop shows CPU and memory per control group, which helps when several services share a box and you need to know which unit owns the queue.
Frequently Asked Questions
Is a Linux load average of 1 always bad?
It depends entirely on your core count. On a single-core machine, a sustained load of 1.00 means runnable tasks are arriving as fast as they can be processed and the queue is at capacity. On a 16-core machine, 1.00 is a very quiet box using roughly a sixteenth of its runnable capacity. Judge the number relative to your CPUs, not as an absolute value.
Why is my load average high when CPU usage is low?
Usually because tasks are stuck in uninterruptible sleep, state D, waiting on I/O that has not returned. Slow or failing disks, saturated I/O, and hung NFS or CIFS mounts all produce this pattern, and D-state tasks count toward load while consuming no CPU. Check %wa in top, the wa column in vmstat 1, and run ps -eo state,pid,comm | grep ‘^D’ to find the culprits.
Should I divide Linux load average by the number of CPU cores?
Yes, that ratio is the most useful single number for capacity decisions, and it is what monitoring tools call load per core. A value of 1.0 means runnable tasks equal your runnable CPU capacity, so the queue is full but not yet growing. Above 1.0 the backlog builds; well below 1.0 you have headroom. In containers, divide by the cgroup CPU quota rather than the host core count.
Why does load average stay high after the server becomes idle?
Because the value you are reading is a moving average with memory. The 15-minute figure decays slowly, so a heavy burst from ten minutes ago still dominates it, and it can take the better part of an hour to settle. Check the 1-minute value to see current pressure. If that one is near zero and the long-term values are still large, you are looking at history, not an active queue.
How should load average be monitored inside a Docker container?
Read the cgroup CPU limits rather than the raw numbers, since PID namespaces do not isolate the load values. Inside the container, cat /sys/fs/cgroup/cpu.max (cgroup v2) or the cpu.cfs_quota_us and cpu.cfs_period_us files (cgroup v1) gives the quota. Container monitoring tools generally report a host-wide load alongside the quota, which is why the two numbers so often disagree.
Conclusion
Start by putting the 1-minute value next to your runnable CPU capacity. A load average explained in linux only becomes actionable when you turn the raw number into a ratio, and the slope from 1-minute to 15-minute tells you whether pressure is building or draining.
Then confirm the cause before you act: uptime for the headline, top for the CPU breakdown, and vmstat 1 for the run queue and I/O wait. If the long-term values look scary but the 1-minute value is near zero, you are looking at residual history rather than a problem that needs fixing now.