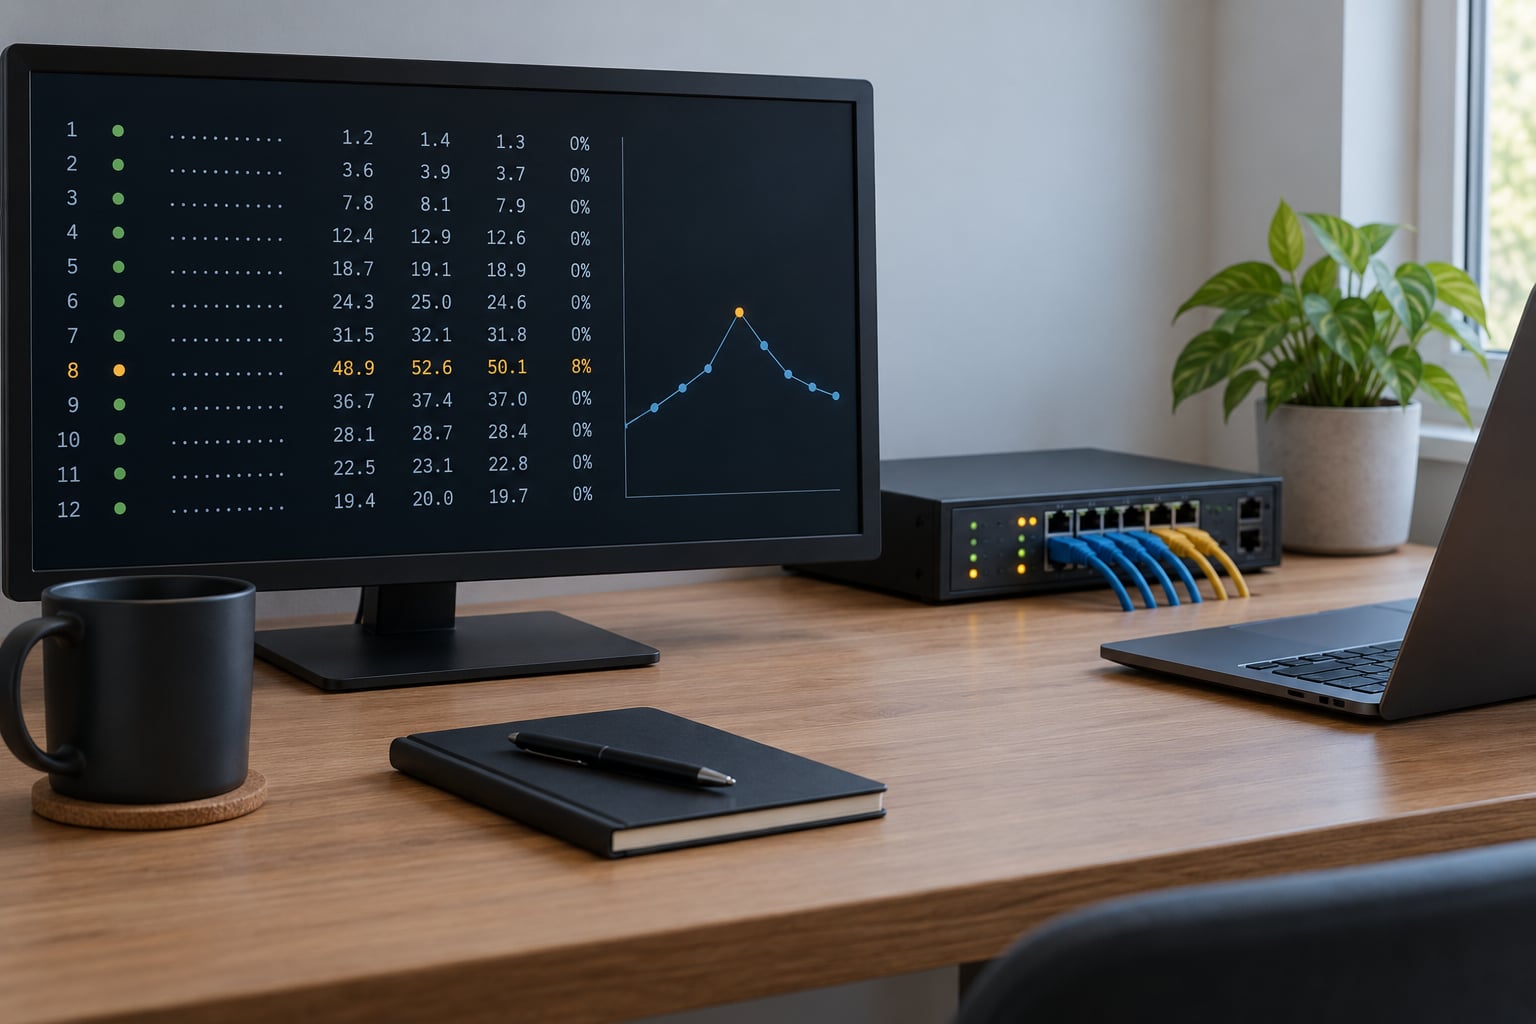
Ping tells you whether a host answers and how long the round trip takes. Traceroute shows you the routers the packets pass through. MTR does both at once, continuously, with per-hop loss and latency over time.
That is the whole difference in one line, and it matters more than it sounds. When a game server stutters or a self-hosted service times out, ping alone leaves you guessing. It confirms the destination is alive but never shows which of the twelve routers between you and it is adding 80 milliseconds.
This guide breaks down the three commands, how they work on the wire, how to read their output without panicking over a row of asterisks, and which one to reach for on Windows, Linux or macOS. No product shopping here, just the diagnostic toolkit that ships with your operating system.
Table of Contents
- Ping vs Traceroute vs MTR Explained at a Glance
- What Does Ping Measure?
- How ping works on the wire
- What ping cannot show you
- Useful ping flags
- What Does Traceroute Measure?
- How traceroute works on the wire
- Why Windows tracert and Linux traceroute behave differently
- The slower, quieter alternatives
- What Does MTR Measure?
- Report mode and the flags worth knowing
- Intermediate-hop loss is usually not a fault
- Ping vs Traceroute vs MTR Explained: How to Read the Results
- What a real ping vs traceroute vs mtr output looks like
- Jitter, spikes and asymmetry
- Which Network Test Should You Use?
- GUI tools that do the same job
- Practical Command Examples for Windows and Linux
- Testing for MTU problems
- Testing the IPv6 path
- What Can Ping, Traceroute, and MTR Not Prove?
- Firewalls, rate limiting and CoPP
- Load balancers and multiple paths
- VPNs, MTU and the hidden hop
- What to attach to a provider ticket
- Which Should You Choose?
- Frequently Asked Questions
- Is MTR better than traceroute?
- Does ping show where packet loss occurs?
- Why do some traceroute hops show asterisks?
- Can I use mtr on Windows?
- Should I use ping, traceroute, or mtr for a slow website?
- Does a traceroute timeout always mean the network is broken?
- Conclusion
Ping vs Traceroute vs MTR Explained at a Glance
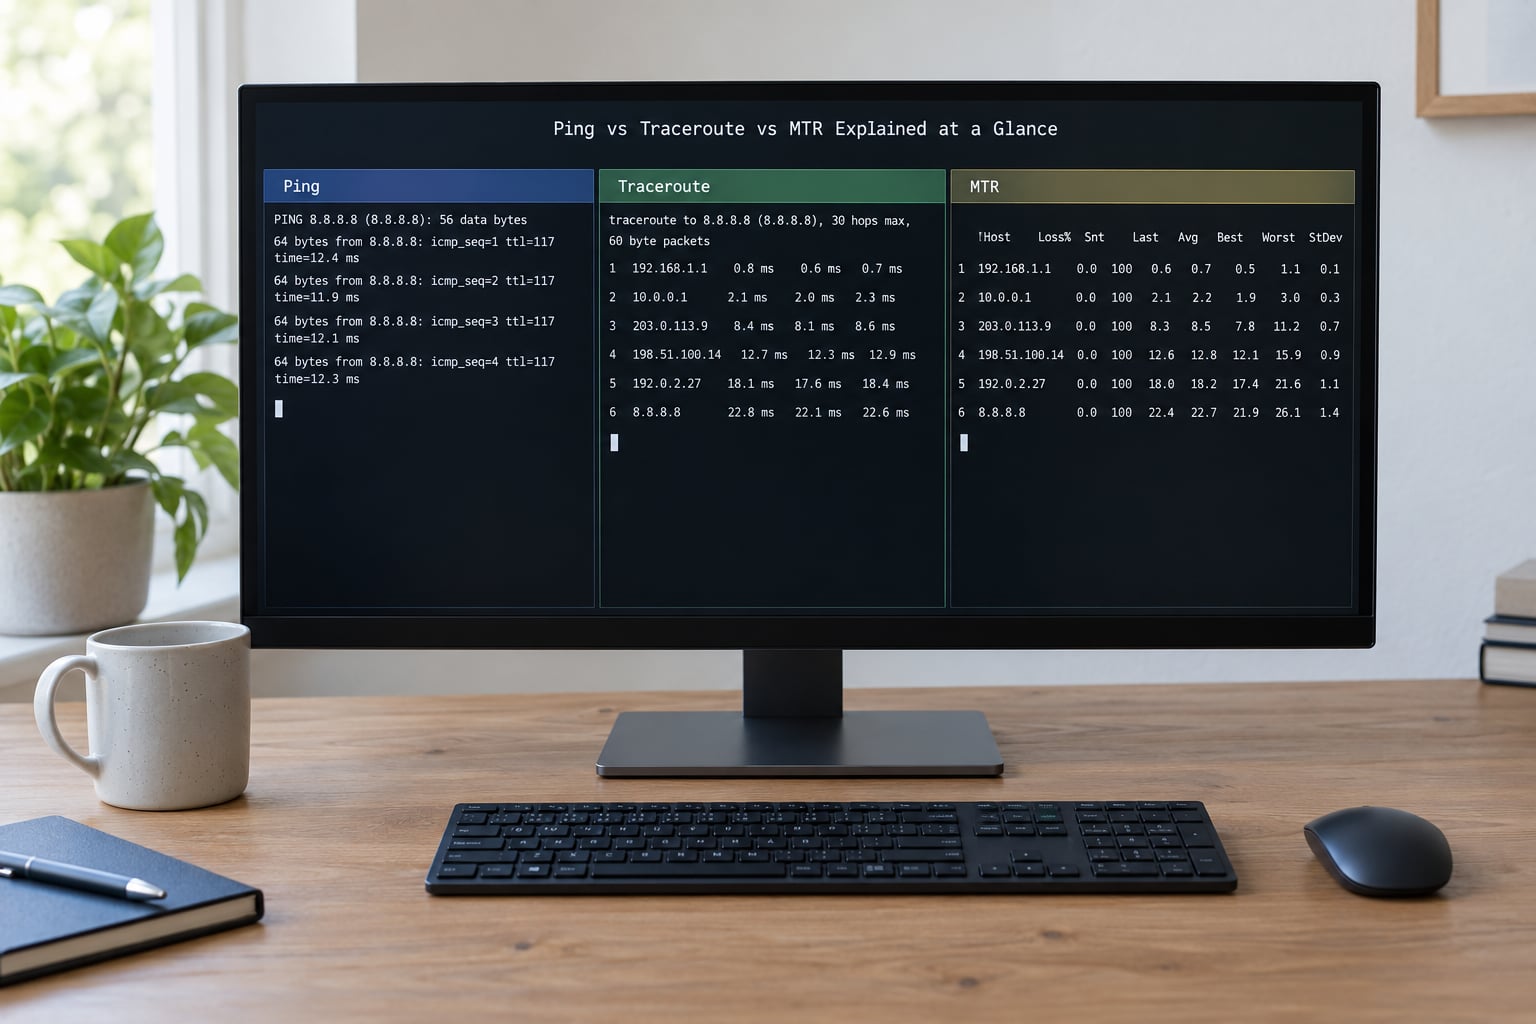
All three tools use ICMP, and all three report round-trip time. The difference is scope: ping asks one question about one endpoint, traceroute asks about the path, and mtr keeps asking until a pattern emerges.
| Criterion | Ping | Traceroute | MTR |
|---|---|---|---|
| What it tests | Reachability and round-trip latency to one host | The hop-by-hop path packets take to that host | The path plus continuous per-hop loss, latency and jitter |
| Protocol | ICMP Echo Request (type 8) to Echo Reply (type 0) | UDP to high ports on Linux and macOS, ICMP Echo on Windows and macOS | Usually ICMP probes with an incrementing TTL, repeated forever |
| Typical output | One line per reply, plus a min/avg/max/mdev summary | One line per discovered hop with three probe times | A live refreshing table of every hop with loss, sent, last, avg, best, worst and jitter |
| Best use case | Quick check that a host is up and roughly how far away it is | One-time look at the route when latency or a failure appears | Finding the hop responsible for loss or jitter over a minute or more |
| Main limitation | Cannot see the path or pinpoint a failing hop | Only three probes per hop, so a single blip looks like a fault | Needs at least a minute of runtime before the numbers mean anything |
If you only remember one thing, remember this rule:
- Ping answers “is it up, and how far?”
- Traceroute answers “which routers are on the way?”
- MTR answers “which hop is hurting, and is it still hurting after a minute?”
What Does Ping Measure?
Ping measures whether a host replies to ICMP echo requests and how long each reply takes to come back. That reply time is the round-trip time, usually shortened to RTT.
How ping works on the wire
Your machine sends an ICMP Echo Request with a sequence number and a timestamp. The target host, if it is up and willing, answers with an Echo Reply carrying the same payload. Your machine subtracts the send time from the receive time and prints the result in milliseconds.
On Linux, one line looks like this:
PING example.com (93.184.216.34) 56(84) bytes of data.
64 bytes from 93.184.216.34: icmp_seq=1 ttl=57 time=11.4 ms
64 bytes from 93.184.216.34: icmp_seq=2 ttl=57 time=12.0 ms
64 bytes from 93.184.216.34: icmp_seq=3 ttl=57 time=11.7 ms
The ttl=57 is worth reading. The destination started its packet with a time-to-live of 64 (a common default), and 57 decrements happened along the way. The remaining TTL tells you roughly how many hops away the host is, which is often a better clue than a distance in miles.
After a set number of replies, ping prints a summary:
--- example.com ping statistics ---
3 packets transmitted, 3 received, 0% packet loss, time 2003ms
rtt min/avg/max/mdev = 11.400/11.700/12.000/0.245 ms
mdev is the mean deviation, a rough stand-in for jitter. A 0.2 ms spread on a wired link is healthy. A 40 ms spread means your connection is breathing, and for a voice call or a game that is usually the thing you feel first.
What ping cannot show you
Ping measures one path to one host with one protocol. It will not tell you which router is congested, and a low ping time to the destination does not guarantee the route between is clean in both directions.
It also will not measure throughput. A 2 ms ping to a server that takes 900 ms to serve a 40 KB page tells you the link is responsive and nothing about capacity. For bandwidth, you want a tool built for it, like iperf3.
Useful ping flags
ping -c 10 hoston Linux sends exactly 10 requests, then stops. On Windows,ping -n 10 hostdoes the same job.ping -c 0 hoston Linux runs forever, which is handy for watching loss build up in real time.ping6 hoston Linux, orping -6 hostwhere the flag exists, forces the IPv6 path instead of IPv4.ping -t hoston Windows pings until you press Ctrl+C. Linux usespingwith no count for the same effect.ping -M do -s 1472 hoston Linux finds the largest unfragmented packet that gets through, which is how you test for MTU problems. Covered in detail further down.
What Does Traceroute Measure?
Traceroute measures the path your packets take by exploiting a field every IP packet carries: the time-to-live. Each router decrements that value by one, and when it hits zero the router discards the packet and sends an ICMP Time Exceeded message back to you, naming itself.
How traceroute works on the wire
Run a traceroute and the first probe goes out with a TTL of 1. Your own router decrements it to zero, drops the packet and complains. The tool records that router and its reply time. The next probe uses a TTL of 2, so the packet survives one hop and dies at the second, and so on until something answers the actual request instead of complaining about it.
Linux output:
traceroute to example.com (93.184.216.34), 30 hops max, 60 byte packets
 1  192.168.1.1        0.412 ms  0.388 ms  0.401 ms
 2  10.20.0.1          2.101 ms  1.980 ms  2.055 ms
 3  62.115.44.9       12.310 ms 12.402 ms 11.988 ms
 4  213.155.135.75    18.744 ms 18.201 ms 19.010 ms
 5  * * *
 6  93.184.216.34     11.612 ms 11.744 ms 11.590 ms
Read it as a list of routers, not a stopwatch. Every hop after the first is a different piece of infrastructure, and the times usually climb because the distance between them is real, not because something is wrong.
Why Windows tracert and Linux traceroute behave differently
This trips up a lot of people. On Linux, traceroute sends UDP packets to high ports starting at 33434, and the router in between returns the Time Exceeded message. On Windows, tracert sends ICMP echo requests instead, because routers along the path reliably forward echo requests to the next hop.
That difference explains why hop 3 in a Windows tracert sometimes appears to “become” hop 2, and why intermediate hops can be missing on one system and present on the other. It is a probing difference, not a routing change.
macOS uses ICMP by default, like Windows, which you can force elsewhere on Linux with traceroute -I host. A router that drops UDP will then answer. If a path only works with one of the two, that router is filtering rather than broken.
The slower, quieter alternatives
Windows also ships pathping. It sends far more probes to each hop than tracert and prints its verdict only at the end, which makes it better at catching loss that a three-probe tracert would miss entirely. On Linux, tracepath fills the same slot without needing root, and it reports the estimated MTU along the way, which is useful when large packets are vanishing.
What Does MTR Measure?
MTR, short for My Traceroute, combines traceroute with a long ping. It keeps sending probes with incrementing TTLs and reports the results as a live table, so you see per-hop loss, average latency and jitter accumulated over every cycle you have let it run.
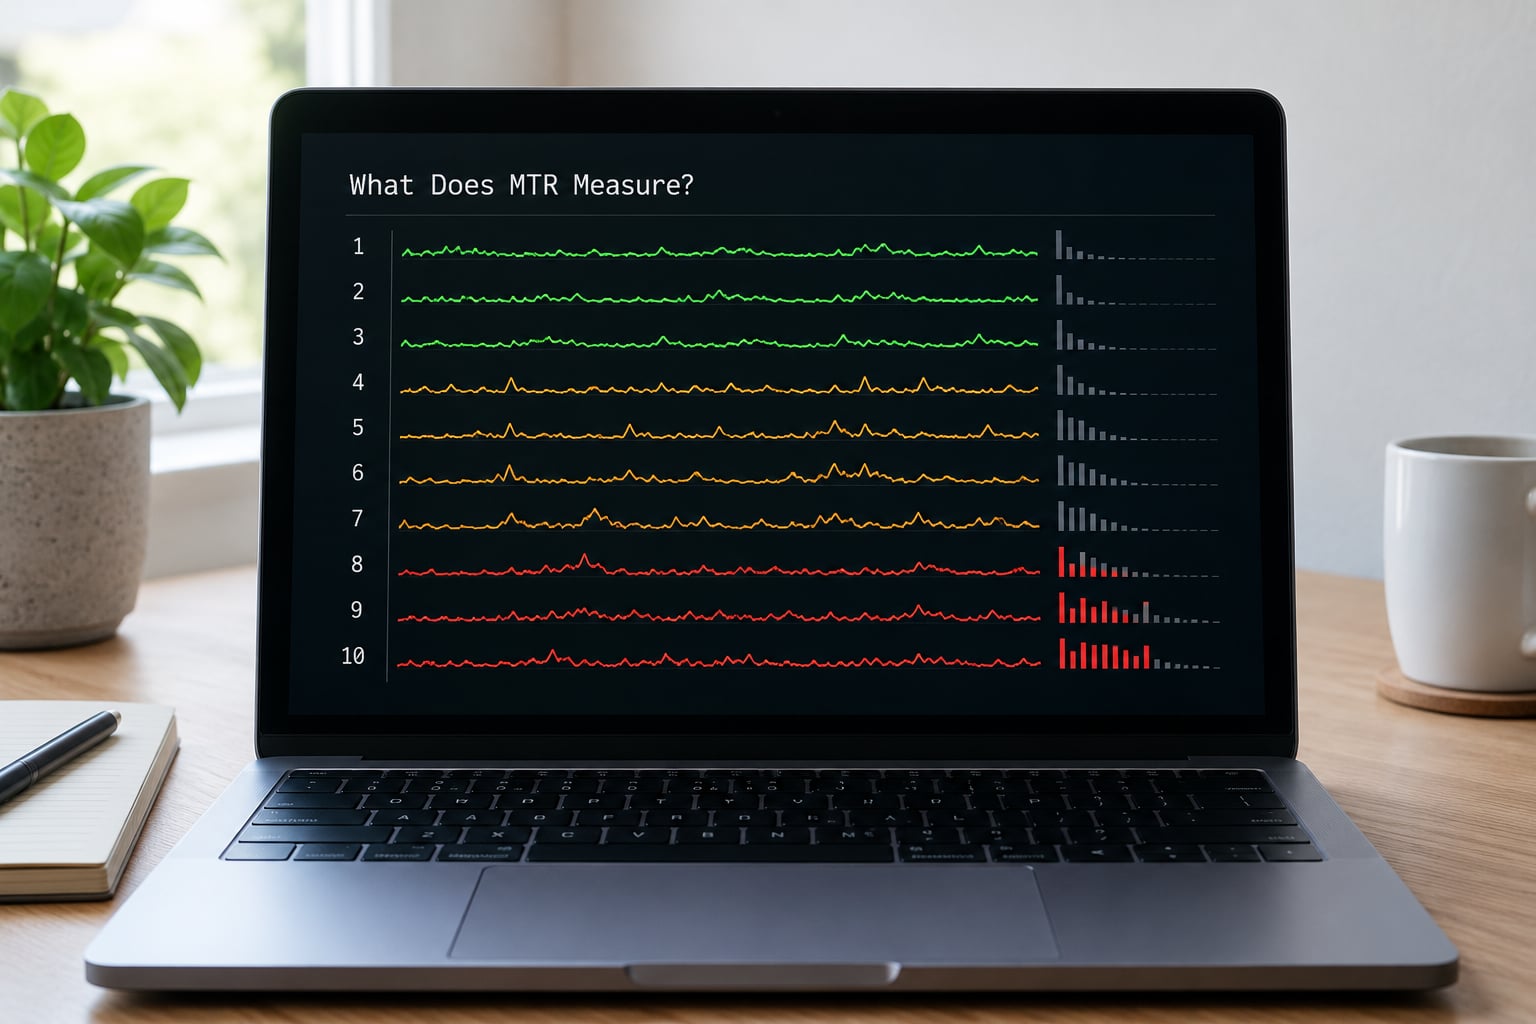
That is the key difference in practice. A traceroute sends three probes per hop and walks away. An mtr that has run for 60 seconds has sent hundreds, so a 12% loss column means something real rather than one unlucky packet.
Keys:  ---   Hop  Host                Loss%   Snt   Last   Avg  Best  Wrst StDev
  1.|-- 192.168.1.1         0.0%    12    0.4   0.4   0.3   0.6   0.1
  2.|-- 10.20.0.1           0.0%    12    2.1   2.2   1.9   2.6   0.2
  3.|-- 62.115.44.9         0.0%    12   12.3  12.5  11.9  13.1   0.4
  4.|-- 213.155.135.75      6.7%    12   18.9  19.2  18.4  22.7   1.4
  5.|-- ???                  0.0%    12    0.0   0.0   0.0   0.0   0.0
  6.|-- 93.184.216.34       0.0%    12   11.6  11.7  11.4  12.2   0.3
Columns: Loss% is the share of probes to that hop that got no reply, Snt counts probes sent, Last is the most recent round-trip time, Avg the mean, Best and Wrst the extremes, and StDev the standard deviation, which is your jitter number.
Report mode and the flags worth knowing
The default interactive mtr redraws forever, which is useless in a terminal you are copying from. Report mode prints once and exits, and it is what you want whenever you are attaching output to a support ticket.
| Flag | What it does |
|---|---|
--report or -r | Print a report and exit instead of redrawing live |
--report-wide or -w | Widen the output so nothing is truncated in an email |
--report-cycles or -c 100 | How many probe cycles to run before the report ends |
--no-dns or -n | Show raw IPs, skip reverse lookups. Much faster and less noisy |
--interval or -i 1 | Seconds between probe rounds, default 1 |
--aslookup | Add the originating autonomous system for each hop, useful for spotting transit providers |
-4 or -6 | Force IPv4 or IPv6 discovery |
The command I end up running most often is mtr -r -w -c 100 -n --aslookup example.com. One minute of data, no DNS noise, ASN labels so you can name the offending network instead of guessing.
Intermediate-hop loss is usually not a fault
Here is the single most misread result in all of network diagnostics: a hop in the middle of an mtr showing 30% or 60% loss while every hop after it shows 0%.
That is almost never real loss. Large backbone routers prioritize forwarding traffic over answering diagnostics, so they apply control plane policing, dropping most ICMP messages on the floor while the actual packets sail through untouched. A busy router can also just be slow to generate replies under load.
The test is simple: look at the final hop. If the destination shows 0% loss, the intermediate loss is an artifact of the router declining to answer rather than a fault you can chase.
Real loss looks different. It shows up at the final hop, and often at the hops after it too, with the loss percentage rising as you move down the path. That pattern means packets are genuinely going missing.
Ping vs Traceroute vs MTR Explained: How to Read the Results
Most bad network troubleshooting comes from reading output literally. Ping, traceroute and mtr output describes replies, not packets, and the gap between those two things is where the confusion lives.
What a real ping vs traceroute vs mtr output looks like
When a host is fine, every reply arrives, times are tight and the TTLs step down evenly. When a route is congested, you get three symptoms: latency that grows at one specific hop and stays high afterwards, a loss column that does not recover, and a wide standard deviation.
Compare these two mtr lines. The first is clean: 0.0% loss, an average of 19.2 ms, a standard deviation of 0.4. The second shows 6.7% loss and a standard deviation of 1.4 with a worst of 22.7. Same route, different week, and the difference is visible in one line.
Here is an interpretation checklist that covers most cases:
- Hop 1 is your own equipment. It is your router or switch, and its latency should be under 1 ms on Ethernet. Loss here is a local problem, full stop.
- Watch where latency steps up, not where it is high. A jump from 12 ms to 75 ms and then staying at 75 ms for the rest of the path tells you where the delay was added. A router far away that reports a high number is still reporting its own link to the previous hop.
- Loss that stops before the last hop is suspect. Intermediate loss with a clean destination is rate limiting.
- Loss that reaches the last hop is real. This is the one that costs you throughput and calls.
- Latency that rises at the destination only usually means the server itself is slow to respond, not that the network is congested.
- A wide standard deviation is jitter, and it is often more damaging to voice and games than a steady higher average.
- Asterisks on one probe do not mean a hop is down. They mean that probe got no reply before the timeout expired.
Jitter, spikes and asymmetry
Loss is not the only problem worth chasing. A link holding 40 ms with a standard deviation of 2 ms feels better than one holding 20 ms with a standard deviation of 25, because the second one stutters unpredictably.
Also remember that traceroute only shows you the forward path. Routers very often take a different route back, so a hop that looks terrible on the way out may never carry your return traffic. Asymmetric routing is normal on most backbones and is a good reminder that a one-directional trace is only half a picture.
Which Network Test Should You Use?
Match the tool to the symptom rather than the other way around. Most wasted time comes from running the wrong diagnostic because it was the first one remembered.
| Situation | Start with | Then use |
|---|---|---|
| Is this host up at all? | ping | Nothing, unless it does not answer, then check DNS and firewall rules |
| Connection feels slower than the bandwidth allows | ping for loss, then iperf3 for actual throughput | mtr if latency looks wrong |
| Latency jumped and stayed high | ping to confirm it is not your own machine | traceroute to find the hop, then mtr to prove it |
| Calls drop or a game stutters intermittently | long ping with a count of 200 or more | mtr for at least a minute, ideally from two networks |
| One site is slow, everything else is fine | ping the site’s IP and its hostname | traceroute, then compare against another destination in the same region |
| You need evidence for a provider ticket | ping over a period of minutes | mtr report mode, plus an iperf3 run if bandwidth is disputed |
| Something only broke on IPv6 | ping6 or ping -6 | mtr -6 to map that path |
The rule of thumb sysadmins use is simple: ping for the symptom, traceroute for the location, mtr for the proof.
GUI tools that do the same job
If you want graphs rather than numbers, WinMTR is the Windows port of mtr. It sends the same ICMP probes the command line does, needs no background service, and usually asks for administrator rights because Windows restricts raw sockets. PingPlotter does the same job with a timeline view and can keep logging, which is handy for catching something that only happens at 3 a.m.
Practical Command Examples for Windows and Linux
Every command below works as written. The flags differ by platform, so use the column that matches your shell rather than translating on the fly.
| Task | Linux | macOS | Windows |
|---|---|---|---|
| Basic reachability | ping -c 4 host | ping -c 4 host | ping -n 4 host |
| Run until stopped | ping host | ping host | ping -t host |
| Path trace | traceroute host | traceroute host | tracert host |
| Trace using ICMP | traceroute -I host | default is ICMP | default is ICMP |
| No DNS lookups | traceroute -n host | traceroute -n host | tracert -d host |
| Path plus MTU | tracepath host | tracepath host | not available |
| Live hop statistics | mtr host | mtr host | WinMTR or pathping host |
| One-minute report | mtr -r -w -c 100 -n host | mtr -r -w -c 100 -n host | WinMTR with a 100 cycle setting |
| IPv6 path | mtr -6 host | mtr -6 host | tracert -6 host |
On Debian and Ubuntu, install mtr with sudo apt install mtr-tcp or the smaller sudo apt install mtr. On Red Hat family systems, sudo dnf install mtr or sudo yum install mtr does the same job. Install the package before you need it, because running mtr against a host you cannot reach produces a permission error rather than a useful result.
Running mtr as root is not required for the ICMP mode that works on most modern kernels, but it does help with raw socket and high cycle counts. The combination worth remembering is sudo mtr -r -w -c 100 -n --aslookup host.
Testing for MTU problems
When small pings succeed but HTTPS pages hang at “waiting for response”, suspect a path MTU problem: something along the way cannot forward a full-size packet and silently drops it, and the sender never finds out because ICMP is blocked. The test is to send an oversized packet with fragmentation disabled and walk the size down until it passes.
# Linux, start at 1472 bytes of payload (1472 + 28 bytes of headers = 1500)
ping -M do -s 1472 -c 2 example.com
ping -M do -s 1400 -c 2 example.com

# macOS
ping -D -s 1472 example.com

# Windows
ping -f -l 1472 example.com
If 1472 fails and 1400 works, the path somewhere is carrying an MTU below 1500. IPv6 has a floor of 1280, and many tunnels and PPPoE links sit in the low 1400s, so this is common on home connections and almost never on datacentre links.
Testing the IPv6 path
Many hosts now answer on both families, and the two paths are routed completely independently. A clean IPv4 ping next to a broken IPv6 ping is a configuration problem, not a network problem. Use ping6 host or ping -6 host, then traceroute -6 host on Linux or tracert -6 host on Windows to see where the IPv6 route stops.
On mtr, -4 and -6 force one family. Running both back to back is the fastest way to prove that a problem is scoped to one of them.
What Can Ping, Traceroute, and MTR Not Prove?
None of these three tools can tell you what is happening to real TCP or UDP traffic. They measure ICMP, and ICMP is a low-priority, easily filtered, frequently rate-limited protocol. Treating an ICMP result as a verdict on your application is the most common mistake in this whole field.
Firewalls, rate limiting and CoPP
Control plane policing is the big one. Backbone routers run with a CPU budget for diagnostics and enforce it, so a flood of traceroute probes gets answered selectively. The router looks like it is losing your packets when it is really just declining to reply to some of your questions.
Firewalls create the opposite illusion. A host that blocks ICMP entirely will fail ping, traceroute and mtr equally, and you will conclude the server is down when the web server is serving pages perfectly. That is why the first move with any “dead” host should be a test of a different protocol, such as a TCP connection attempt on port 443.
Hotspots and corporate gateways produce a third version of the same problem. They throttle or block ICMP, so your results describe the gateway rather than the path behind it.
Load balancers and multiple paths
If a hostname resolves to several addresses, ping may hit one server while the next ping hits another, and the numbers appear to jump around for no reason. Run the test against a single IP to get a stable reading. Anycast and CDN edges make the same point from the other direction, where a low-latency result depends entirely on which location you landed in.
VPNs, MTU and the hidden hop
A VPN adds a tunnel with its own MTU and its own encrypted hop that the underlying path cannot see. If problems appear only while the tunnel is up, test both with and without it, and re-run the MTU check described above.
And remember asymmetry. A traceroute shows the forward path only, so a perfect trace out does not mean the return trip is healthy.
What to attach to a provider ticket
When escalating to an ISP or hosting provider, vague complaints get closed. Send evidence instead, and keep it small:
- A long ping showing the moment loss started, with timestamps.
- An mtr report of at least 60 cycles in report mode, saved as text or a screenshot.
- The same mtr from a second network, for example a phone hotspot, to show the problem follows the route rather than your connection.
- An iperf3 result if bandwidth rather than latency is being disputed.
- Your public IP, the destination IP and the timestamps in one timezone, so their logs line up with yours.
That package is what turns a support conversation into a fix. The multi-vantage mtr is the single artifact that most often changes an ISP’s response, because it turns a complaint into a reproducible measurement.
Which Should You Choose?
Choose by question, not by preference.
- Ping when you need a fast yes or no on reachability, or a baseline latency number. It takes seconds and needs no setup.
- Traceroute when latency looks wrong and you want a single snapshot of the route to see which hop introduced the delay. Treat intermediate loss with suspicion.
- MTR when the problem is intermittent, when you suspect real loss, or when you need evidence you can hand to someone else. Give it at least a minute, and run it from more than one network if the result matters.
On Windows, add pathping for a slow but trustworthy loss verdict. If you want graphs rather than numbers, WinMTR and PingPlotter do the same job visually.
Frequently Asked Questions
Is MTR better than traceroute?
Neither is better; they answer different questions. Traceroute takes a snapshot of three probes per hop and is ideal for a quick look at a route. MTR repeats those probes continuously, so after a minute it can distinguish real loss from a single dropped reply. Use traceroute when you want the path, and mtr when you need proof about loss or jitter.
Does ping show where packet loss occurs?
No. Ping only reports end to end loss between your machine and the destination, so it can tell you that packets are going missing but never which router dropped them. To locate loss, follow a ping that shows loss with a traceroute for the path, then an mtr lasting at least 60 seconds to see whether the loss sits on one hop or reaches the destination.
Why do some traceroute hops show asterisks?
Asterisks mean that probe got no reply before the tool gave up. The router either dropped the ICMP Time Exceeded message, rate-limited it under control plane policing, or the reply took longer than the timeout. A single asterisk on one line is normal. Several consecutive asterisks followed by a responsive hop usually mean the rest of the path is fine.
Can I use mtr on Windows?
Native mtr is not part of Windows, so you need a port. WinMTR is the usual choice and is safe: it sends the same ICMP probes as the Linux command and reports the same per-hop statistics. It needs administrator rights because Windows restricts raw sockets. Windows also has pathping built in, which is slower but gives a reliable loss verdict.
Should I use ping, traceroute, or mtr for a slow website?
Start with ping against the site’s IP address, then against its hostname. If the IP is fast but the hostname is slow, the delay is in DNS resolution. If both show high latency, run traceroute to find the hop where the delay appears. If the site feels intermittent rather than consistently slow, skip straight to a one-minute mtr report.
Does a traceroute timeout always mean the network is broken?
No, and this is the most misread result in network diagnostics. Many backbone routers rate-limit ICMP so they can prioritise real traffic, which makes them look lossy when your packets are passing through perfectly. The test is to look at the final hop: if the destination shows replies with 0% loss in an mtr run, the intermediate loss is an artifact rather than a fault.
Conclusion
Ping vs traceroute vs mtr explained comes down to scope. Ping checks one endpoint, traceroute maps the path, and mtr watches that path long enough to tell a real fault from a router declining to answer.
Start with a ping. If the host is up and the latency looks wrong, run a traceroute and find the hop where the delay appears. If the problem is intermittent, let mtr run for a full minute and read the final hop before you blame anything in the middle. That is the sequence, and it resolves most network complaints before anyone needs to open a ticket.