
journalctl is the systemd command that queries logs collected by systemd-journald, including kernel messages, service output and application records stored in an indexed binary journal. These journalctl commands you should know cover the work you actually do on a server: finding errors, narrowing to one service, reading the boot that just failed, filtering by time or priority, and keeping the journal from filling a disk. Last checked against systemd 257 documentation in 2026.
If you have ever stared at a blank screen after running a journalctl command as a normal user, section 4 explains why. If your previous boot vanished after a reboot, section 12 has the fix.
Table of Contents
- journalctl Commands You Should Know at a Glance
- 1. View Recent System Logs
- 1.1. Basic Syntax and Output Verification
- 2. Show Logs at Error Priority or Higher
- 3. Filter Logs by systemd Unit
- 4. Inspect Logs from the Current Boot
- 5. Search Logs Since a Specific Time
- 6. Search Logs Until a Specific Time
- 7. Follow Logs in Real Time
- 8. Follow One Service with -u and -f
- 9. Find Logs by systemd Log ID
- 10. Limit Journal Output to Useful Fields
- 11. Export Logs as JSON for Analysis
- 12. Check Disk Usage and Vacuum Old Logs
- Frequently Asked Questions
- Why does journalctl say no journal files were found?
- How do I make journal logs persist after a reboot?
- Why do I need sudo for some journalctl commands?
- How can I view logs from a previous Linux boot?
- Can I combine journalctl unit, priority, and time filters?
- How do I safely reduce the size of systemd journal logs?
- Conclusion
journalctl Commands You Should Know at a Glance
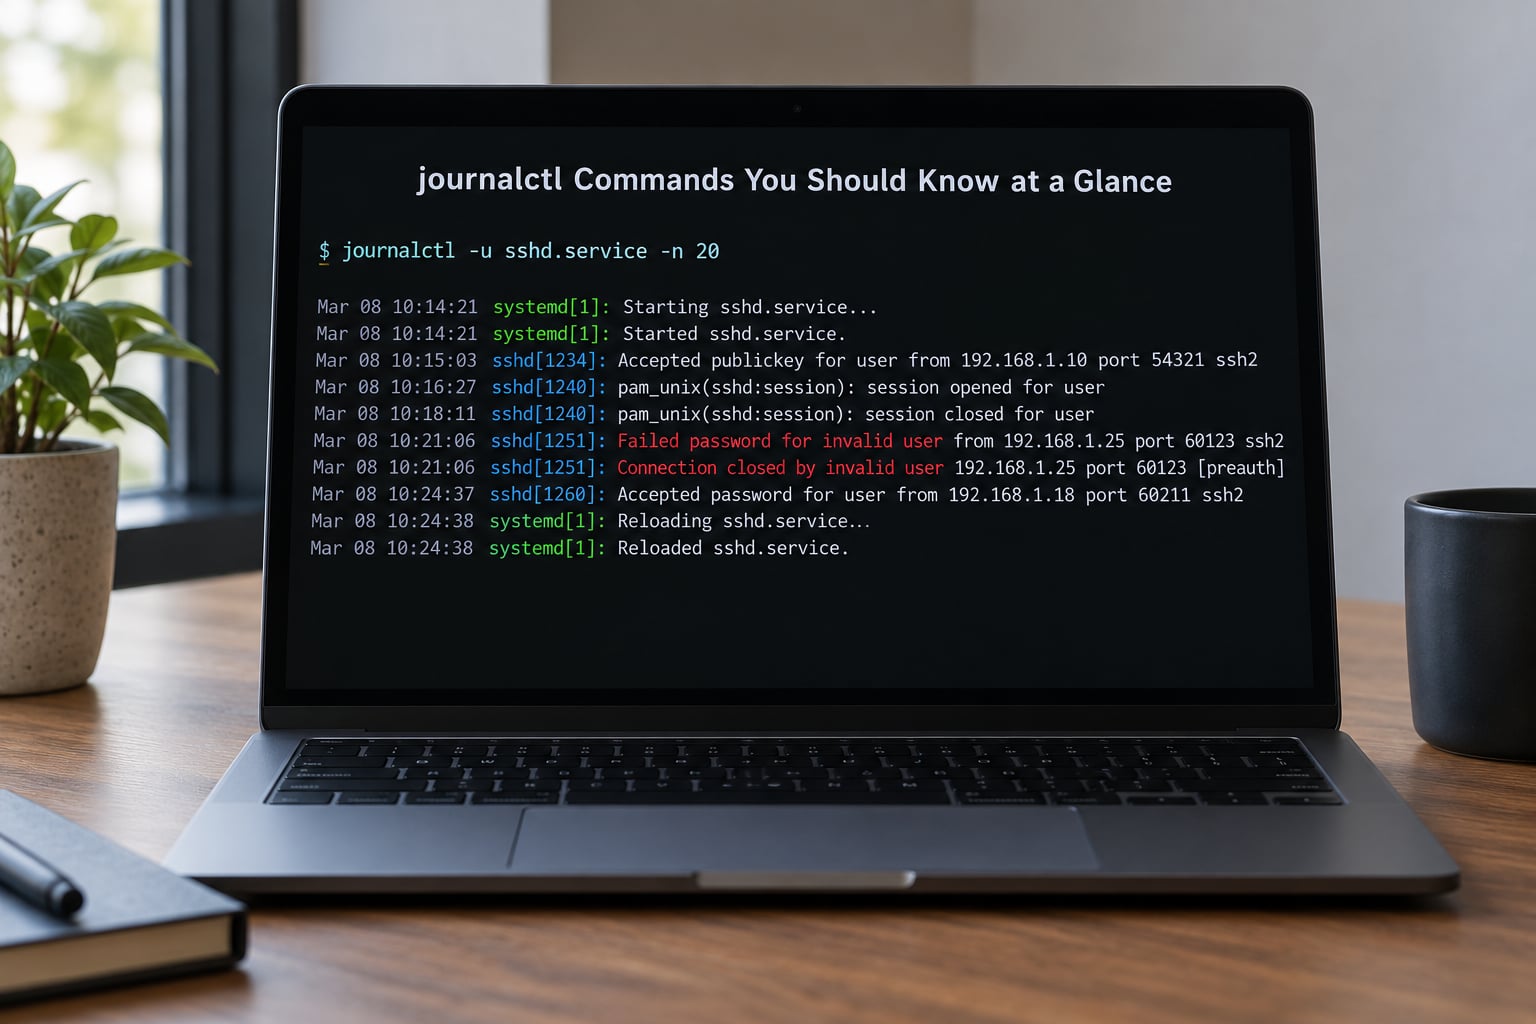
Here is the short version. Each row is a real command you can paste without editing it.
| Command | What it does |
|---|---|
journalctl -n 50 | Show the last 50 entries and exit |
journalctl -f | Stream new entries as they arrive |
journalctl -u ssh.service | Show everything logged by one systemd unit |
journalctl -u nginx -n 200 -f | Follow one service live |
journalctl -p err -b | Errors and worse from the current boot |
journalctl -p 3 -xb | Community triage one-liner: numeric 3 equals err |
journalctl -b -1 | Read the boot before the last reboot |
journalctl --list-boots | List boot IDs with start and end times |
journalctl -k | Kernel ring buffer messages only |
journalctl --since "1 hour ago" | Everything logged inside a time window |
journalctl --since 09:00 --until 10:00 | Bounded window for one incident |
journalctl -t sshd | Match entries by syslog identifier |
journalctl _PID=1234 | Match a process by its PID field |
journalctl -o short-iso -n 100 | Compact output with ISO timestamps |
journalctl -o json | jq .MESSAGE | Machine-readable output for scripts |
journalctl --disk-usage | Report how much space the journal holds |
The two I would memorize first are -u and -b -1. Between them they answer most of what people arrive here asking.
1. View Recent System Logs
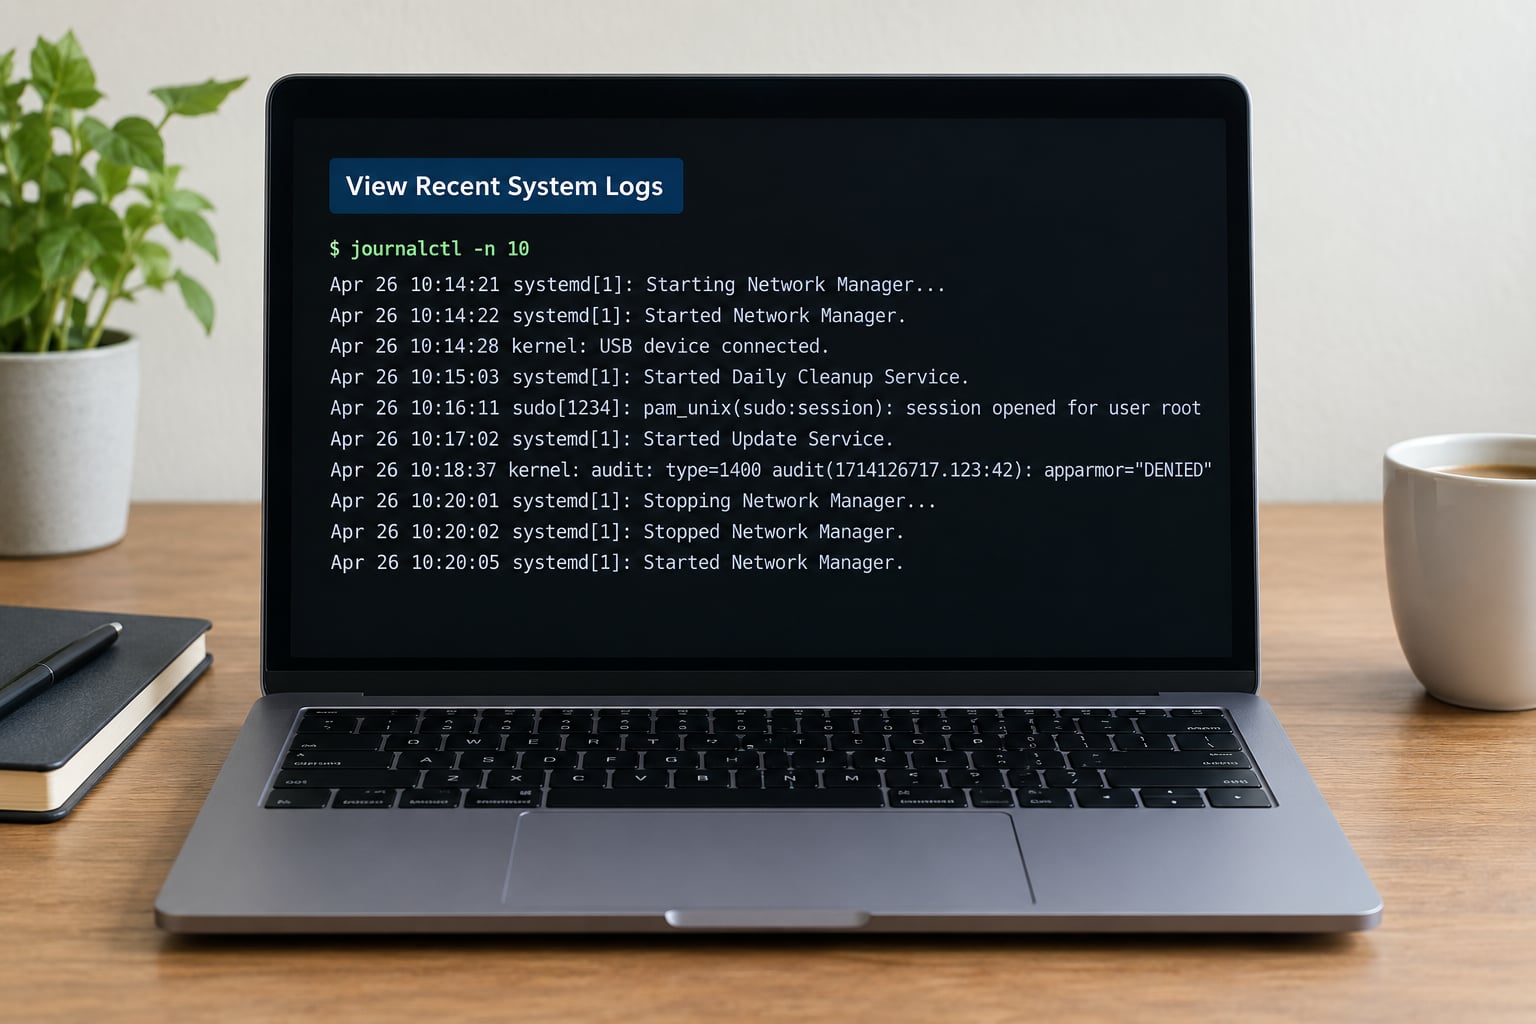
Run journalctl with no options and you get the 10 most recent entries, then the tool hands the output to a pager. That pager trips people up, so the habit worth building is to always say how much you want.
Two flags solve nearly every complaint about the bare command:
-n 200shows the last 200 entries instead of 10.--no-pagerprints straight to the terminal, which matters in scripts and over SSH sessions with no TTY.
1.1. Basic Syntax and Output Verification
Every journalctl query is the same shape: the command, then options, then optional field matches. journalctl [options] [matches] is the whole grammar.
To confirm a query actually worked, look at four things in the output. The unit column tells you the message came from the unit you asked for. The priority word (err, warning, info) tells you what the filter kept. The timestamp range tells you the window matched. For boot queries, every entry shares one boot ID you can confirm with journalctl --list-boots.
If the output is empty, the filter did not match anything, which is different from the journal being empty. Section 4 covers the other common reason for an empty screen.
2. Show Logs at Error Priority or Higher
-p filters by syslog priority, and it is the fastest way to cut a noisy boot down to the lines that matter. A common correction first: -p is priority, not process ID. Filter by PID with _PID=1234 instead.
Priorities run from 0 to 7, and lower numbers are worse:
| Name | Number | Use it for |
|---|---|---|
| emerg | 0 | System is unusable |
| alert | 1 | Action must be taken immediately |
| crit | 2 | Critical condition |
| err | 3 | Error, the one you usually want |
| warning | 4 | Warning |
| notice | 5 | Normal but significant condition |
| info | 6 | Informational |
| debug | 7 | Debugging messages |
journalctl -p err -b returns err and everything worse. A range such as -p warning..err returns only those two levels, and the order matters: the range runs from the lower number to the higher one. -p err..warning matches nothing and prints a hint telling you to swap them, which is a nicer failure than silent empty output.
The one-liner journalctl -p 3 -xb appears constantly on Arch and Rocky forums because it compresses three ideas into one line: 3 is err, -x adds the catalog explanation line, and -b scopes it to the current boot.
One correction about -x: it means --catalog, which appends the explanatory text that systemd has for a message. It does not mean extra or verbose, as a few tutorials claim. If you want the full trusted fields for one unit, journalctl -u nginx.service -xe is still the command to type.
3. Filter Logs by systemd Unit
A systemd unit is anything systemd manages: a service, a socket, a mount, a device, a timer. -u selects one of them.
journalctl -u sshd.service returns everything that unit logged, including its own stdout and stderr. Add -n 100 to keep it to the tail, and add --since "20 min ago" when you are watching a restart loop.
You can repeat -u to watch several units, and journalctl treats repeated unit filters as OR:
journalctl -u nginx.service -u php8.3-fpm.service --since "1 hour ago"Sockets and mounts work the same way, which makes -u useful when you want to know what a removable disk or a network share did:
journalctl -u systemd-logind.service
journalctl -u home.mnt-data.mount --since today
If output stays empty even though the service is running, do not keep changing flags. The usual cause is logging setup inside the unit, not the journal itself.
4. Inspect Logs from the Current Boot
-b limits the query to one boot session. With no argument it means the current boot, which is why journalctl -b is equivalent to journalctl --boot=0.
journalctl -b -1 reaches the previous boot. This is the answer to what happened before the reboot, and it is the first thing to reach for after a crash, a failed upgrade or a mystery reset.
journalctl --list-bootsThe list-boots output gives you a boot ID, its start and end time, and whether the journal for that session is still present. If a boot you remember is missing from the list, the journal for it was never written to disk.
That happens by default on many distributions. The journal lives in /run/log/journal, which is a tmpfs and disappears on reboot, unless /var/log/journal exists and Storage=persistent is set in /etc/systemd/journald.conf. Once you enable it and restart journald, older sessions still in memory cannot be recovered.
Kernel-only queries save time during boot trouble. journalctl -k and journalctl -kf show only kernel messages, and users on hardware forums report that -kf surfaces disk and CPU errors that dmesg and desktop log viewers miss.
5. Search Logs Since a Specific Time
--since sets the lower bound of the window. The relative forms are the most convenient and avoid locale issues:
journalctl --since "15 min ago"
journalctl --since "1 hour ago"
journalctl --since today
journalctl --since yesterday
You can also be precise. ISO dates work without guessing at locale formats:
journalctl --since "2026-09-28 14:30:00"
journalctl --since "2026-09-28 14:30" --no-pager | less
One caution from people who query months of history: very broad windows are slow, and piping them into a pager makes the terminal appear frozen. Narrow the range, or drop --no-pager and redirect to a file.
6. Search Logs Until a Specific Time
--until sets the upper bound. On its own it is less useful, but paired with --since it gives you a closed window, which is the cleanest way to isolate one incident.
journalctl --since "2026-09-28 14:00" --until "2026-09-28 14:15" -u docker.serviceThat query asks a single question: what did docker.service do in that fifteen-minute window. Start the window a couple of minutes before the symptom and end it a couple of minutes after, because log timestamps and your notes are rarely in perfect agreement.
7. Follow Logs in Real Time
-f streams new entries as journald receives them. It is the same idea as tail -f against a log file, except the source is the journal index, so you can combine it with any filter.
journalctl -f
journalctl -u systemd-networkd -f --since "5 min ago"
Stopping is just Ctrl+C in your terminal. The follow ends; the service keeps running. Nothing about -f touches the unit, which is worth saying because beginners sometimes hesitate to press Ctrl+C out of fear.
-F is the follow variant that prints the full entry, including all trusted fields, rather than the compact one-line form.
8. Follow One Service with -u and -f
This is the working loop for a service that will not start. Watch it while you trigger the failure:
journalctl -u myapp.service -fThen restart it from a second terminal, or reload the unit after editing it. A healthy start produces a short sequence of ordered messages. A failing one usually repeats the same error on every attempt, and the repetition is the clue.
Three shapes are worth recognizing. A repeating line every few seconds points at a dependency that never comes up, such as a missing mount or a network unit stuck at start. A single error followed by silence usually means systemd gave up and the service is inactive. A clean start followed by a crash loop points at the application, not the unit file.
For a fuller picture in the same view, journalctl -u myapp.service -xe is the shorthand most admins type first. Add -b -1 when the service behaved differently before the last reboot.
If the service writes nothing at all while running, check how it logs. The top answer on Stack Overflow’s “view journalctl logs of running service” thread is that many daemons buffer output and flush it on exit, so you see nothing until the process stops. That is application behavior, and no journalctl flag fixes it.
9. Find Logs by systemd Log ID
-t matches the syslog identifier, the short tag a program stamps on its messages, such as sshd, cron or NetworkManager.
journalctl -t sshd --since today
journalctl -t systemd-networkd -p warning..alert
For comparison, -t matches an identifier, not a process ID. Filtering by PID uses field matching with the underscore prefix:
journalctl _PID=1234
journalctl _UID=1000 --since today
journalctl _EXE=/usr/bin/sshd
journalctl _SYSTEMD_UNIT=nginx.service
Field matching is the most precise tool in the set and the least documented. List the fields available on a sample entry with journalctl -n 1 -o verbose, then match any of them by name. Exclusions such as _PID!=1 and numeric ranges such as _PID=1000..2000 work the way you would expect.
One useful exception to identifier filtering: kernel messages do not carry a useful identifier, so -k is the way to query them.
10. Limit Journal Output to Useful Fields
-o controls format. Reading speed depends almost entirely on picking the right one.
| Format | What you get | Use it for |
|---|---|---|
-o short | Hostname, service, PID, message | Normal terminal reading |
-o short-iso | short with ISO 8601 timestamps | Correlating with app logs |
-o cat | Message text only | Piping into grep |
-o verbose | All metadata fields per entry | Discovering field names |
-o json | One JSON object per entry | Scripts and jq |
-o json-pretty | Same, indented for humans | Inspecting structure |
-o export | Journal’s own binary stream format | Backup and transfer |
To keep only what you need, -N prints named fields:
journalctl -u nginx.service -n 100 -N MESSAGE -N _PID --no-pagerThat output is easy to hand to another tool because it has no decoration at all.
11. Export Logs as JSON for Analysis
Save a window of one unit before you start changing things. Future you will be glad to have it when the bug stops reproducing.
journalctl -u myapp.service --since "2026-09-28 09:00" --until "2026-09-28 12:00" -o json > myapp.json
journalctl -b -1 -o json > previous-boot.json
For streaming formats that never buffer the whole set, use json-seq for newline-delimited JSON or json-sse for server-sent events when something downstream expects it.
You do not need jq to be useful here, but if you have it the pipeline is short:
journalctl -u myapp.service --since today -o json | jq -r '.MESSAGE' | sort | uniq -c | sort -rn | headThat counts repeated messages, which is a fast way to spot a service writing the same warning thousands of times. Without jq, journalctl -u myapp.service --since today -o cat | sort | uniq -c | sort -rn | head gets you close enough.
For long-term storage, compress the export. journalctl -b -1 -o export > prev.journal followed by gzip prev.journal keeps a backup that is only a few kilobytes larger after compression.
12. Check Disk Usage and Vacuum Old Logs
Before assuming a disk problem, measure the journal:
journalctl --disk-usageThe output reports the archived journal, the active journal and the total as percentages of a 4 GB cap, which is a useful reference point for whether you are near a limit. It needs root on most systems, so run it with sudo.
Cleanup is a separate action, and it deletes archived logs permanently. Rotate first, then vacuum:
sudo journalctl --rotate
sudo journalctl --vacuum-time=2weeks
sudo journalctl --vacuum-size=500M
sudo journalctl --vacuum-files=10
--vacuum-time keeps entries newer than a relative age. --vacuum-size keeps the most recent data up to a cap. --vacuum-files keeps only the newest N journal files. They cannot be combined, and only the most recently written files survive.
Two maintenance commands that get overlooked: sudo journalctl --verify checks the integrity of the archived files and reports corruption, and --header prints the entry headers of a journal file, which helps when you need to reason about what a backup contains.
If a service is flooding the journal instead of the journal growing because it is large, vacuuming only postpones the problem. journald applies rate limiting by default, and the thresholds are set in /etc/systemd/journald.conf with RateLimitIntervalSec and RateLimitBurst. Turn that off only if you truly want every message, because the result is a journal that buries everything else.
Persistent journals are controlled in the same file. Set Storage=persistent, create /var/log/journal with mkdir -p /var/log/journal, then run sudo systemctl restart systemd-journald. From that point on, previous boots survive a reboot, which is the fix that changes what you can investigate after a crash.
To make the journal survive reboots, also check the size caps while you are in there. SystemMaxUse sets the overall ceiling, SystemKeepFree reserves room for other programs, SystemMaxFileSize caps each file, and MaxRetentionSec sets an age limit. Restart journald after editing, and check the result with journalctl --disk-usage.
Frequently Asked Questions
Why does journalctl say no journal files were found?
That message means the journal directory itself is missing, which is different from a query that simply matches nothing. On a system with an unprivileged journal, logs live in memory only and appear under systemd-journald logs. Create the persistent directory with mkdir -p /var/log/journal, set Storage=persistent in /etc/systemd/journald.conf, then restart systemd-journald. If the directory exists but you still see the message, check that it contains a machine subdirectory.
How do I make journal logs persist after a reboot?
Set Storage=persistent in /etc/systemd/journald.conf, create /var/log/journal with mkdir -p /var/log/journal, then run systemctl restart systemd-journald. New entries are written to disk instead of the tmpfs at /run/log/journal. Verify with journalctl u002du002dlist-boots and confirm the boot count keeps growing after a reboot. Entries already in memory cannot be recovered, so only boots from this point on are preserved.
Why do I need sudo for some journalctl commands?
Unprivileged users can read only journal entries belonging to their own user, sessions, units and processes. System-wide messages such as kernel output, failed service starts and boot records need root. Adding your account to the systemd-journal group grants read access without full root, but take effect only after you log out and back in. Maintenance commands such as vacuum, rotate and verify always require sudo.
How can I view logs from a previous Linux boot?
Use journalctl -b -1 for the boot before the most recent one, and journalctl u002du002dlist-boots to see every boot ID with its start and end time. Each entry in a boot-scoped query carries that boot ID, so you can confirm which session you are reading. If the earlier boot is missing from the list, the journal for it was volatile and Storage=persistent was never enabled.
Can I combine journalctl unit, priority, and time filters?
Yes. journalctl takes several filters at once and applies them together, so journalctl -u sshd.service -p err u002du002dsince today returns only error-level messages from ssh.service logged today. Repeated unit filters behave as OR, while unit plus priority plus time behave as AND. When you get no output, test one filter at a time, starting with -u alone, to find which condition is excluding the entries.
How do I safely reduce the size of systemd journal logs?
Run journalctl u002du002ddisk-usage first so you know the current footprint. Then use sudo journalctl u002du002drotate to flush the active file, followed by sudo journalctl u002du002dvacuum-time=2weeks to keep only recent entries, or u002du002dvacuum-size=500M for a hard cap. Vacuuming deletes archived logs permanently, so export anything you still need with -o export before running it. Keep the budget in check with SystemMaxUse in journald.conf.
Conclusion
Work through the journalctl commands you should know in this order: start with journalctl -p err -b to see what the current boot complains about, then narrow it with -u and a --since window. If the problem predates a reboot, run journalctl -b -1 and confirm the session still exists with --list-boots. Follow live output only when the failure is still happening, and export what you find before you change anything.
One last habit: turn on Storage=persistent now, while the machine is healthy. Every one of these commands is more useful when the previous boot is still there.