To debug a slow boot in Linux, run systemd-analyze time to split the total into firmware, loader, kernel and userspace seconds, then systemd-analyze blame and systemd-analyze critical-chain to rank the services that ate the time and trace the dependency path that actually delayed your login screen. Most slow boots come down to one service, one waiting device or one firmware setting, and every one of those is measurable.
The whole job takes about ten minutes on a healthy machine. You need root or sudo, a booted system, and the ability to reboot twice — once to get a clean baseline, once to confirm your fix.
Here is the copy-paste bundle I give people first. It answers the same question the top Ask Ubuntu thread asks for, and it is the fastest way to hand someone enough data to help you.
systemd-analyze time
systemd-analyze blame | head -15
systemd-analyze critical-chain
systemctl --failed
journalctl -b -p err --no-pager
If you paste those five outputs into a forum post, you will usually get an answer in one round trip. Everything below explains what each number means.
Table of Contents
- What You Need
- Step-by-Step: How to Debug a Slow Boot in Linux
- How to Debug a Slow Boot in Linux with systemd-analyze
- Find the Slow Service in the Boot Journal
- Separate Firmware, Kernel, and Userspace Startup Time
- Check Disk, Filesystem, and Network Dependencies
- Test and Fix Suspected Startup Services
- Confirm the Improvement and Document the Result
- Mistakes to Avoid While Measuring
- Common Mistakes
- Frequently Asked Questions
- Which command shows what is slowing down my Linux boot?
- How do I find out which systemd service is taking the longest to start?
- Can I safely disable a slow systemd service?
- Why does systemd-analyze show a fast boot while startup still feels slow?
- How can I check whether a slow Linux boot is caused by storage or networking?
- Conclusion: What to Do First
What You Need
Most of this workflow assumes systemd is PID 1, which has been true on Ubuntu, Debian, Fedora, RHEL, Arch, openSUSE and Mint for years. Check with ps -p 1 -o comm=. If it prints something else — init, on a SysV or BSD-style system — the systemd commands below will not exist and I cover that case in the FAQ.
Beyond that, you want four things:
- Root or sudo access. Reading the journal usually does not need it, but overriding a service does.
- A clean reboot baseline. Reboot once before you measure. A boot you interrupted, or one run while a package upgrade was happening in the background, tells you nothing.
- A journal that survives reboots. Without it you cannot compare the boot you just fixed with the boot before it.
- Patience for two reboots. One to measure, one to verify.
Enabling the persistent journal takes one command on most systems. Anything already logged in /run/log/journal only exists in RAM and disappears at reboot.
sudo mkdir -p /var/log/journal
sudo systemd-tmpfiles --create --prefix /var/log/journal
sudo journalctl --flush
Verify it worked with journalctl --list-boots. If you see several boots listed with dates instead of boot-0 and a time range, the journal is persisting.
One caveat about commands and paths: this guide uses systemctl, journalctl and /proc/cmdline, which are the same across modern distributions. Where a command differs, I say so. Distro wikis remain the last word when something here does not match what you see.
Step-by-Step: How to Debug a Slow Boot in Linux
This is the loop. Measure the phase, rank the services, trace the chain, read the journal, check the hardware dependencies, change one thing, reboot, measure again. Skipping straight from “feels slow” to “disable something” is how people break a working system.
How to Debug a Slow Boot in Linux with systemd-analyze
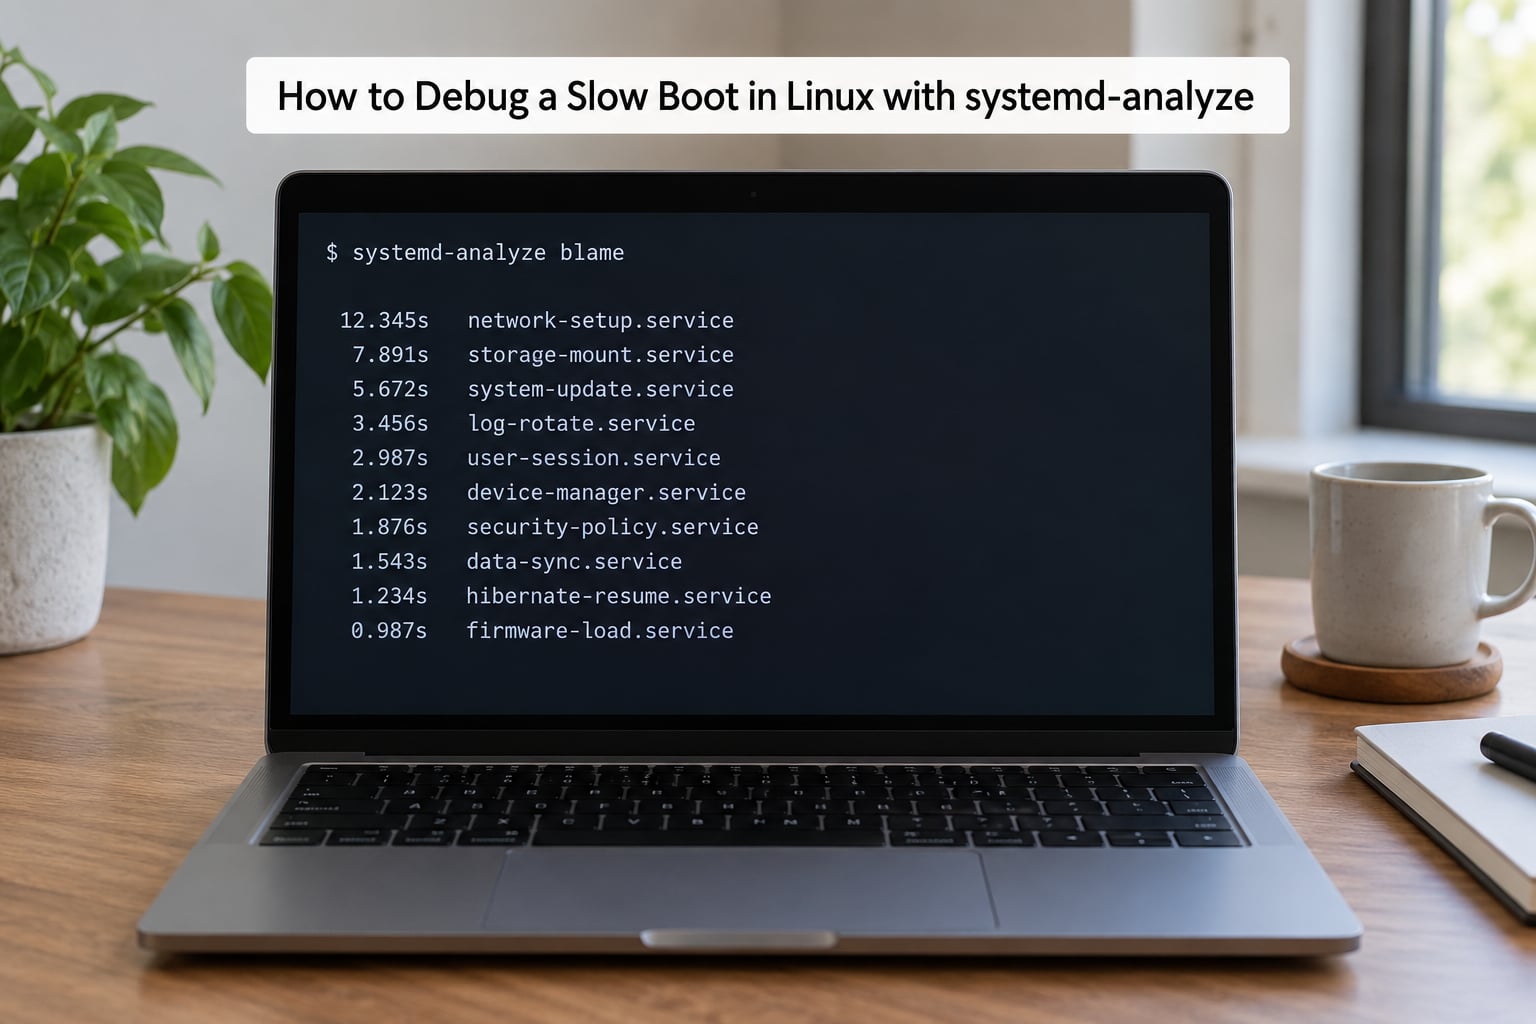
systemd-analyze is the whole toolkit in one binary. Start with the plain form, because the phase breakdown decides which of the remaining subcommands can even help you.
systemd-analyze time
Typical healthy output on a modest SSD laptop looks like this:
Startup finished in 8.4s (firmware) + 1.1s (loader) + 3.9s (kernel) + 2.2s (initrd) + 6.3s (userspace) = 22.1s
Read that line left to right. The numbers in parentheses are what came before Linux loaded, the kernel number is kernel initialization, and userspace is the time systemd spent bringing services up to your target. The total at the end is your wall-clock boot.
Next, rank services by how long they took:
systemd-analyze blame | head -15
1.234s NetworkManager-wait-online.service
1.102s systemd-udev-settle.service
0.881s snapd.service
0.744s dev-sda1.device
0.612s accounts-daemon.service
The second column is initialization time, not total unit lifetime. A service that starts instantly and then idles for a minute will not appear here at all — which is exactly why blame alone misleads people, and why the next command matters.
systemd-analyze critical-chain
This prints the dependency path that actually gated your login target. A line like 1.883s systemd-udev-settle.service nested four levels deep means: until udev finished settling, everything downstream waited, and every second it spent was a second added to your boot. The @ symbols mark units with jobs still pending; + marks units that started successfully.
Rule of thumb: a unit at the top of blame that does not appear in critical-chain ran in parallel and cost you nothing. Fix the chain, not the leaderboard.
Two more subcommands earn their keep. systemd-analyze plot > boot.svg renders a colour-coded SVG timeline you can open with xdg-open boot.svg — it makes idle gaps between services visible in a way numbers do not. And systemd-analyze verify /lib/systemd/system/some.service checks a file for syntax errors before you restart it.
systemd-analyze dump is the deep option: it prints thousands of lines of internal state. Useful for a bug report, useless for a first pass.
Find the Slow Service in the Boot Journal
Timings tell you what is slow. The journal tells you why, and it is where retries, timeouts and failed mounts show up. Every command below works from any user account.
journalctl -b --no-pager | tail -50
journalctl -b -p err --no-pager
journalctl -b -1 -p warning --no-pager
journalctl -b -k --no-pager | grep -i timeout
-b means the current boot; -b -1 means the previous one, which is where you look when the problem started after an update. -p err and -p warning filter by severity, and -k restricts output to kernel messages. That last one, filtered for timeout, is how you spot the device waits that systemd silently retried in the background.
Once you have a suspect, read its own log. This is usually where the sentence that explains everything lives:
journalctl -b -u NetworkManager-wait-online.service --no-pager
journalctl -b -u snapd.service --no-pager
Patterns worth grepping for in a slow boot: reached target timestamps to see when a target was actually hit, Job lines showing what systemd was waiting on, Timed out waiting for a device that never appeared, and dependency failed for a unit that never started at all.
journalctl -b --no-pager | grep -E "Timed out|dependency failed|reached target"
If a service appears to start instantly but the boot still hangs, look for a second unit queued behind it. A fast service on a blocked dependency chain is a common illusion, and it is why the journal and critical-chain are read together.
Separate Firmware, Kernel, and Userspace Startup Time
This is where most guides stop and the number stays mysterious. The (firmware) figure is time spent before the boot loader was even loaded — your BIOS or UEFI POST, memory training, device enumeration, and on many laptops a slow TPM or a fast-boot feature that never quite works as advertised. Linux cannot change it, but it can tell you how much of your boot it owns.
Users on CachyOS and other minimal distributions have reported boots where systemd-analyze time showed roughly 1 minute 40 seconds total with about 1 minute of that in firmware and loader, meaning userspace was never the problem. Fedora users have posted the opposite shape: 12.2 seconds of firmware, 7 seconds of loader, and a fast remainder. If your userspace number is small and the total is huge, stop tuning services and go read the boot phase table.
| Phase | What happens | Typical cause of delay | What to run |
|---|---|---|---|
| Firmware | BIOS or UEFI POST, memory training, device enumeration | TPM, memory training on a cold boot, dozens of attached devices, fast boot toggled off | Look at the (firmware) number in systemd-analyze time; time it in the BIOS setup screen |
| Boot loader | GRUB menu, disk and initramfs loading | GRUB timeout on a dual-boot machine, slow or failing disk | Set GRUB_TIMEOUT=0 in /etc/default/grub, then run sudo update-grub |
| Kernel | Driver init, module loading, device probe | A driver initcall stalling on hardware, a device that is not answering | journalctl -b -k, then dmesg | grep _init after enabling initcall_debug |
| Initramfs | Early userspace, udev, assembling the root filesystem | Dracut scanning every block device, slow or degraded storage | Add rd.debug or rd.break=pre-pivot to the kernel command line |
| Userspace | systemd starting services toward your target | Network wait-online, a hanging mount, snapd, an unnecessary daemon | systemd-analyze blame and critical-chain |
To see the exact kernel command line currently in use, read cat /proc/cmdline. It tells you whether debug parameters are still enabled from a previous investigation, which is worth knowing before you interpret anything.
One more trick worth the effort: systemd-analyze has a firmware subcommand on recent systemd versions. If your version has it, systemd-analyze firmware reports EFI variable and TCG measurements with their durations, which is more detail than the single (firmware) number gives you.
Check Disk, Filesystem, and Network Dependencies
Two dependency classes cause most unexplained waits: a device that never answers, and a network that never comes up. Neither shows up as an obvious error, because systemd retries quietly.
For storage, compare what the kernel found against what the filesystem has mounted:
lsblk -f
df -hT
findmnt --verify --verbose
A filesystem on /boot that takes seconds to mount points at storage, not software. A degraded software RAID or a failing disk shows retry storms in journalctl -b -k. On a machine with an unusual SATA or NVMe link, users have traced sudden multi-second jumps back to a cable or port change — moving the drive to a different port fixed it — so try that before you start editing configuration.
Do not run filesystem repair tools on mounted data. If findmnt --verify reports errors, unmount the affected filesystem first, or boot into the recovery mode described later in this guide.
For networks, the classic offender is NetworkManager-wait-online.service. It exists so services that genuinely need a live network do not start before one is available. On a laptop with several interfaces, or on a dual-boot machine, it can wait out a full timeout for a link that will never come up. Check whether it is on your critical chain:
systemd-analyze critical-chain | grep -i wait-online
journalctl -b -u NetworkManager-wait-online.service --no-pager
Remote filesystems behave the same way. An autofs mount or an NFS home directory listed in /etc/fstab with _netdev can hold a target open while the network is still negotiating. Compare journalctl --list-boots across a few boots — if the time appears only on Wi-Fi machines, the network path is where I would look.
Test and Fix Suspected Startup Services
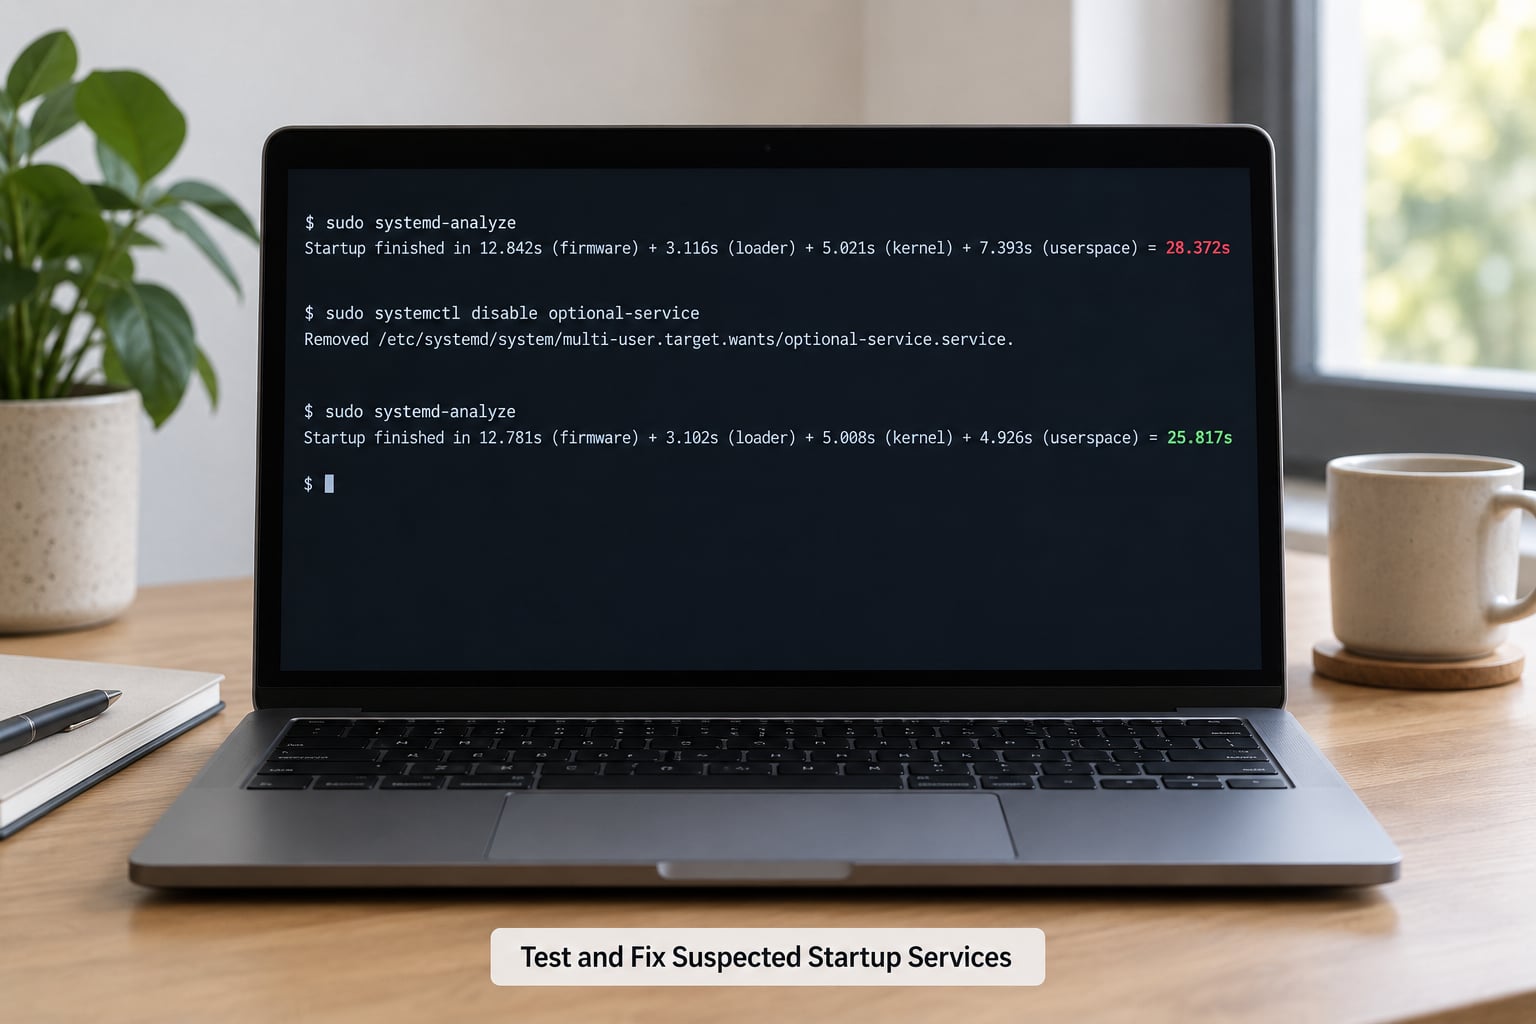
Now change something — but only one thing, and only after you know it is on the critical chain. Here is the culprit reference I keep open.
| Service | Why it waits | Confirm with | Fix | Revert |
|---|---|---|---|---|
| NetworkManager-wait-online.service | Blocks until a network interface is configured, or times out trying | systemd-analyze critical-chain | grep wait-online | sudo systemctl disable --now NetworkManager-wait-online.service | sudo systemctl enable --now NetworkManager-wait-online.service |
| systemd-udev-settle.service | Waits for all device events to clear; slow with flaky USB or storage | journalctl -b -u systemd-udev-settle.service | sudo systemctl mask systemd-udev-settle.service | sudo systemctl unmask systemd-udev-settle.service |
| snapd.service | Starts the Snap daemon and its seeding services on Ubuntu and Mint | systemd-analyze blame | grep snapd | sudo systemctl disable --now snapd.service | sudo systemctl enable --now snapd.service |
| apt-daily-upgrade.service | Runs unattended package work in the background after boot | systemctl list-timers | grep apt | sudo systemctl disable --now apt-daily-upgrade.timer | sudo systemctl enable --now apt-daily-upgrade.timer |
| modemmanager.service | Probes for a modem that is not present | journalctl -b -u modemmanager.service | sudo systemctl mask modemmanager.service | sudo systemctl unmask modemmanager.service |
| A stale mount unit | Waits on a filesystem or device that is gone | systemctl --failed | Remove or comment the entry, then sudo systemctl daemon-reload | Restore the entry in /etc/fstab |
disable stops a service starting at boot but leaves the unit file alone; mask makes it impossible to start, deliberately or accidentally. Both are reversible with enable or unmask. I prefer masking for something I am unsure about, because the failure mode is loud instead of silent.
Before touching anything, check what the unit needs. Dependencies live in the unit file:
systemctl cat NetworkManager-wait-online.service
systemctl list-dependencies --reverse NetworkManager-wait-online.service
If something you rely on sits above it, the safe answer is to leave it running and speed it up instead. Overriding a shipped timeout beats disabling the service outright:
sudo systemctl edit NetworkManager-wait-online.service
[Service]
ExecStart=
ExecStart=/usr/lib/systemd/systemd-networkd-wait-online --timeout=10
That edit creates a drop-in under /etc/systemd/system/, not a vendor file. Removing that file and running sudo systemctl daemon-reload puts everything back exactly as it was. Never edit /lib/systemd/system/ or /usr/lib/systemd/system/ directly — a package upgrade overwrites your change silently and leaves you debugging a fix that no longer exists.
If you suspect the delay is inside the kernel or the initramfs rather than in a service, add debug parameters to the kernel command line instead:
loglevel=7 ignore_loglevel systemd.log_level=debug initcall_debug
initcall_debug prints the duration of each built-in driver initialisation path, which is how you find a driver stalling the kernel phase. loglevel=7 with ignore_loglevel overrides the quiet default so you actually see it. On Dracut systems, rd.debug and rd.break=pre-pivot drop you into a shell before the pivot to root, where you can check the root filesystem by hand. In Dracut’s emergency shell, remount read-write with mount -o remount,rw / before editing anything.
Two warnings. Heavier logging genuinely slows the boot down, so never compare a verbose boot against a normal one. And when you are done, remove the parameters from /etc/default/grub (or whichever file your distribution uses), run the grub update command for that distro, and reboot — otherwise you are carrying debug overhead forever and misreading the next measurement.
Confirm the Improvement and Document the Result
Reboot, wait for the login screen, then measure again under conditions as close to the first baseline as you can — same peripherals, same network state, same power source. On a laptop, plug in the charger; a cold battery changes firmware behaviour and the comparison is worthless.
systemd-analyze time
systemd-analyze blame | head -10
systemctl --failed
Compare boots rather than trusting a single run. With a persistent journal in place:
journalctl --list-boots
for b in -3 -2 -1 0; do journalctl -b $b --no-pager | grep -m1 "Startup finished"; done
Four boots in one line each is enough to tell a real improvement from a good morning. If the change held, record the before and after totals somewhere you will find them — a comment in a personal notes file, a tag in your config repo, whatever you actually use. A boot-time fix with no note gets undone by the next person who runs systemctl enable --now on a hunch.
Finally, verify you did not break anything. Confirm the services you touched are behaving, check systemctl --failed is empty, and if networking was involved, test a real connection rather than trusting a green icon. Then make sure systemctl is-enabled still reports what you expect for anything else you touched during the investigation.
Mistakes to Avoid While Measuring
A few things go wrong repeatedly, and they are worth naming while the commands are fresh.
- Treating the top blame row as the culprit. It is often a service that ran in parallel and cost you nothing. Confirm it appears in
critical-chainbefore touching it. - Changing three services and rebooting once. You learn nothing and cannot undo selectively. One change, one reboot.
- Measuring a single boot. Disk caches, background updates and network probes vary wildly. Compare at least three.
- Editing unit files in
/libor/usr/lib. Usesystemctl editso the override is a drop-in you can delete. - Disabling something required.
NetworkManager-wait-onlinelooks disposable until a service that needs a live network fails to start. Checklist-dependenciesfirst. - Treating a long firmware wait as a userspace problem. If
(firmware)dominates, no amount of service tuning will show up in your results. - Leaving debug kernel parameters on. Verbose logging slows the boot, so every later measurement is skewed until you remove them and rebuild the boot configuration.
Common Mistakes
The mistakes above are worth restating as corrections, because the symptoms repeat in forum threads for years. Each of these has a straightforward fix.
Chasing units that are not on the critical path. The correction is to read systemd-analyze critical-chain before blame whenever the two disagree. A service taking two seconds while something it depends on waits ten seconds is a symptom, not a cause.
Measuring only one successful boot. The correction is a three-boot comparison. If you only have a volatile journal, you cannot do this retroactively, which is the whole argument for enabling persistence first.
Disabling services you did not check. The correction is systemctl list-dependencies --reverse <unit> before every change, and preferring a shortened timeout over a full disable when the service still matters.
Editing vendor unit files. The correction is sudo systemctl edit <unit>. It writes a drop-in that survives upgrades and deletes cleanly.
Assuming the delay is software because you use Linux. The correction is to read the (firmware) and (loader) numbers honestly. Large firmware times point at POST, memory training, TPM work or fast boot settings, which are firmware problems with firmware answers.
Ignoring the shutdown hang. A machine that stops with stop job running messages usually has the same culprit as the slow boot: a unit that will not release a resource. The same journal filters apply in reverse, using journalctl -b -1 and reading the last entries rather than the first.
A few habits that make the whole process less painful: compare boots taken under similar conditions, keep every override in version control if you use dotfiles, and check your distribution’s own documentation when a command behaves differently. Ubuntu, Fedora and Arch document different sets of caveats, and a page written for one of them will quietly mislead you on the other two.
Frequently Asked Questions
Which command shows what is slowing down my Linux boot?
Start with systemd-analyze time. It splits your total boot into firmware, loader, kernel, initrd and userspace seconds, which tells you which phase to investigate. Follow it with systemd-analyze blame to rank services by initialization time, and systemd-analyze critical-chain to see which dependency path actually delayed the login target. journalctl -b -p err then explains why any of them waited.
How do I find out which systemd service is taking the longest to start?
Run systemd-analyze blame and sort the output, or pipe it through head to see the slowest entries. The second column is initialization time, not total lifetime, so a slow-running service may never appear. Cross-check the top entries against systemd-analyze critical-chain: if a unit is not in the chain, it ran in parallel and added nothing to your boot. Then read its log with journalctl -b -u unitname to see what it was waiting for.
Can I safely disable a slow systemd service?
Usually, but check first. Run systemctl list-dependencies u002du002dreverse on the unit to see what needs it, and read the service description with systemctl cat. Disable stops it starting at boot and leaves the file intact; mask prevents it from starting at all. Both revert with enable or unmask. Services like NetworkManager-wait-online can often be sped up with a shorter timeout instead of being removed, which keeps anything depending on a live network working.
Why does systemd-analyze show a fast boot while startup still feels slow?
Three things are usually going on. The firmware and loader numbers are often the bulk of the boot and happen before systemd can measure anything useful. The login screen can appear while a background service still runs, so the desktop feels slow after the timer stops. And a fast unit on a blocked dependency chain hides the real blocker. Read the whole systemd-analyze time line, not just the userspace figure, and compare with journalctl u002du002dlist-boots across several boots.
How can I check whether a slow Linux boot is caused by storage or networking?
For storage, run lsblk -f and df -hT to confirm what mounted, then findmnt u002du002dverify to test the filesystems, and search the kernel log with journalctl -b -k for timeout messages. For networking, check whether NetworkManager-wait-online appears in systemd-analyze critical-chain, and look for automount or NFS entries in /etc/fstab carrying the _netdev option. If the delay only appears on Wi-Fi boots, suspect the network path.
Conclusion: What to Do First
If you do nothing else, run this sequence. Reboot once for a clean baseline, run systemd-analyze time and read the whole line including firmware and loader. Run systemd-analyze blame and critical-chain, and pick the slowest unit that appears in the chain rather than the slowest unit overall.
Confirm it with journalctl -b -u <unit>, make one reversible change with systemctl edit or a single disable, then reboot and re-measure. Compare against the previous boot with journalctl --list-boots before you decide whether anything improved. That loop takes about ten minutes and it answers the question every time.