Procmon is Microsoft’s free Sysinternals tool for watching what programs on Windows actually do to the file system, the Registry, and each other, in real time. This guide covers how to use Procmon on Windows from first launch through to a filtered, saved log you can hand to a colleague, plus boot-time tracing and the command-line switches for automated runs. Allow about 15 minutes for the basics, and expect the filtering section to be the one you come back to most.
The reason Procmon earns its place in a troubleshooting kit is that Windows itself tells you almost nothing about this activity by default. Task Manager shows you CPU and memory. Procmon shows you the sequence: which process opened a file, whether it succeeded, which registry key it queried first, and what failed.
Table of Contents
- What You Need
- How to Use Procmon on Windows: Step-by-Step
- 1. Install and launch Process Monitor
- 2. Choose what to capture before starting
- 3. Start and stop a focused capture
- 4. Filter the results by process and operation
- 5. Search for a file, registry key, or network target
- 6. Interpret the main event columns and results
- 7. Save, export, and document the evidence
- 8. Capture activity during Windows startup
- 9. Use Procmon from the command line
- Common Mistakes
- Procmon vs Process Explorer vs Process Hacker vs Sysmon
- Frequently Asked Questions
- What is Procmon in Windows?
- Do I need to run Procmon as administrator?
- Is Procmon the same as Process Explorer?
- How do I know if Procmon is running or capturing?
- Why does my Procmon log fill up so fast, and how do I cut the noise?
- How do I find the boot log and where does PML_BOOT.PML end up?
- Conclusion
What You Need
You need a supported Windows machine and administrator rights, then the current Sysinternals package. Process Monitor v4.11 requires Windows 11 or Windows Server 2019 on the client side; older releases are still on the Sysinternals archive page but you rarely need them.
Administrator rights are the part people skip. Right-click Procmon.exe and choose Run as administrator, then accept the UAC prompt. Without elevation you will still see plenty of rows, which makes it look like the tool is working while quietly missing everything that matters, such as most system services and other users’ processes.
You also need somewhere safe to reproduce the problem. Procmon is passive and non-destructive, but your machine is not: if you are debugging an installer or a boot hang, do it on a test box or a snapshot you can roll back. Keeping a few gigabytes of free disk space helps too, because the backing file grows quickly during a busy capture.
Download the tool from the Sysinternals downloads page on Microsoft Learn, or run it from Sysinternals Live, which fetches the latest signed binary on demand and is handy on machines where you cannot install anything. Extract the ZIP to a folder you will remember. Sysinternals Live keeps the binary in its own directory rather than installing anything system-wide.
How to Use Procmon on Windows: Step-by-Step
1. Install and launch Process Monitor
Download the Process Monitor ZIP from Microsoft, extract it, and run Procmon.exe as administrator. Accept the licence agreement on first run. Windows 11 may flag the file as an unrecognised or unverified publisher download, which is expected for a Sysinternals binary.
If you installed the whole Sysinternals Suite instead, Procmon is one entry among many tools. The standalone ZIP is smaller and keeps the executable out of Program Files, so I use it when I am deliberately probing something.
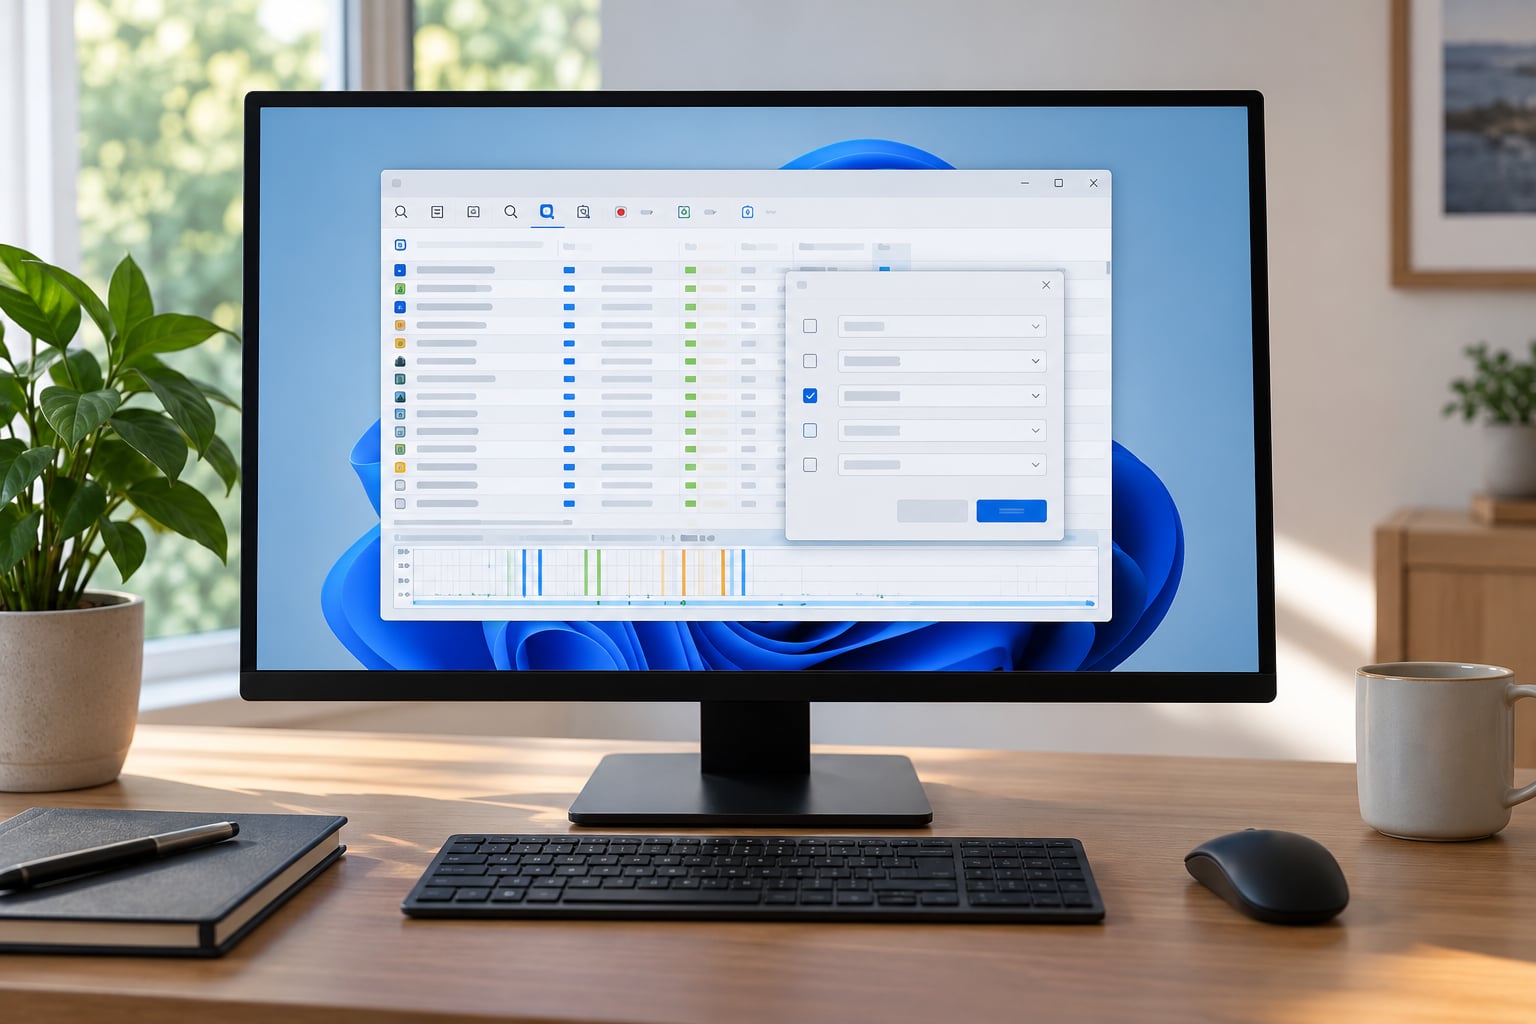
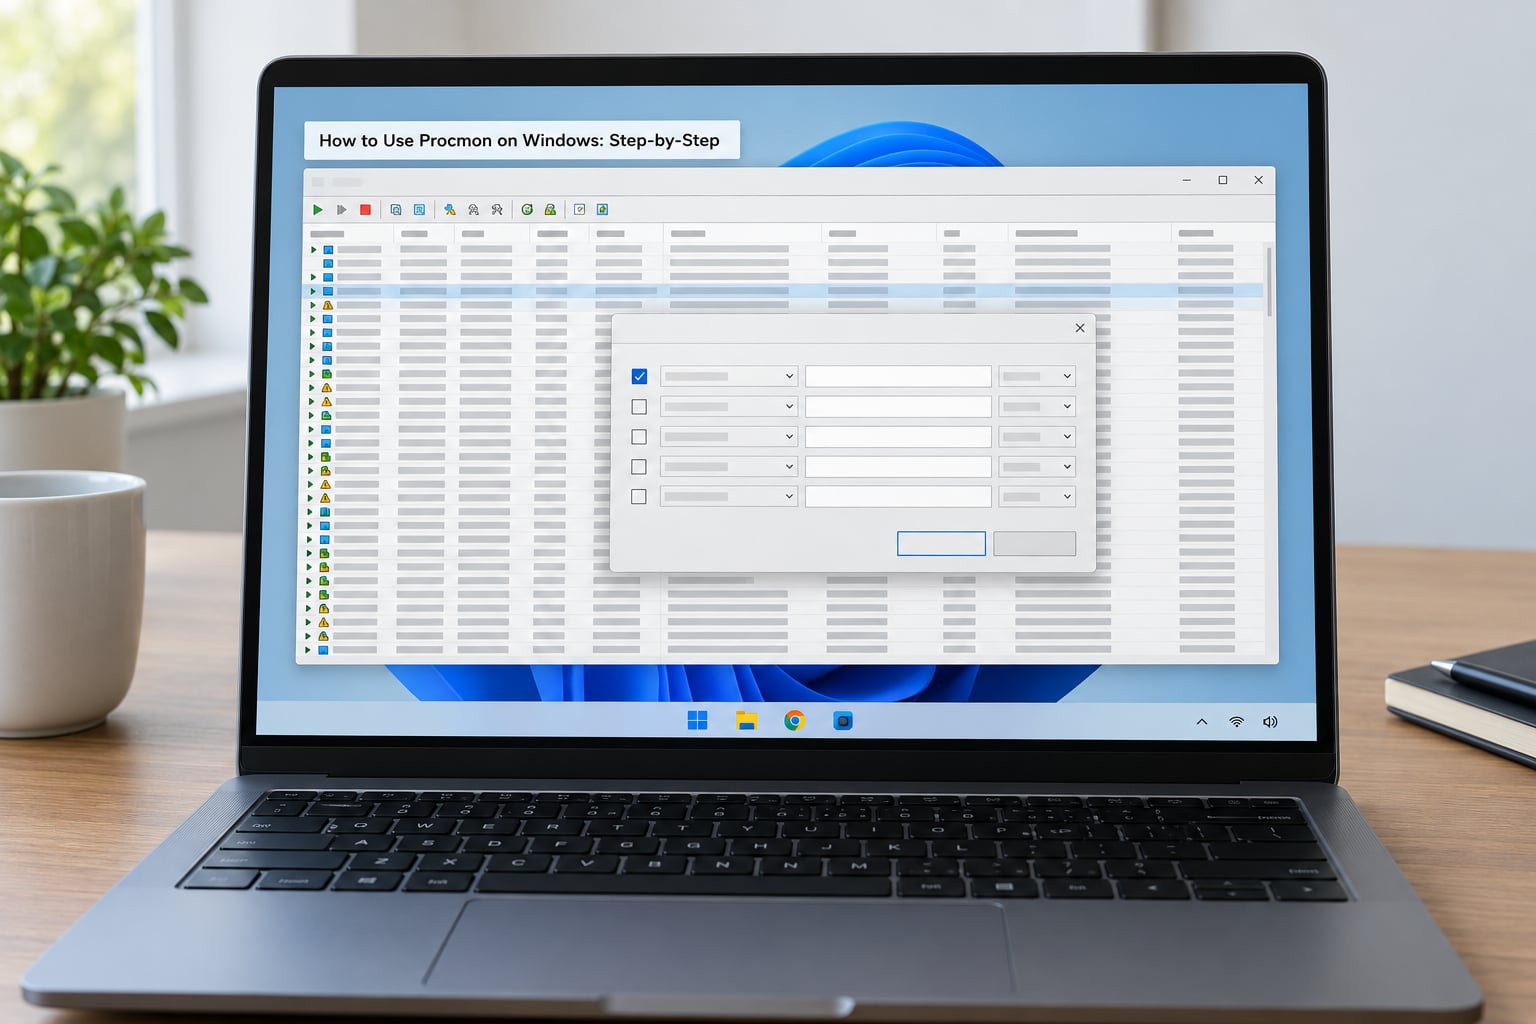
The first thing you see is the Process Monitor Filter dialog, which loads with the author’s recommended noise exclusions already in place. Leave those alone on day one, click OK, and you are looking at a live capture that is already running.
2. Choose what to capture before starting
The Events menu controls what the driver streams into the window. File System, Registry, Network, Process/Thread and Load Image are the categories most people care about, and all are enabled by default.
Two of those deserve a warning. The Network category records socket operations such as ConnectTCP and Sendto, which tells you that an address was contacted, but it does not capture packet contents. If you need the payload, that is a packet capture tool’s job, not Procmon’s.
Profiling and stack walking are separate toggles, both off by default. Turning on thread stacks is genuinely useful later, but it adds overhead and a wall of symbol names to every row, so keep it off until you are chasing a specific operation. For a first capture, leave the defaults, run for a few seconds, and stop. Ten seconds of unfiltered activity is already tens of thousands of rows.
3. Start and stop a focused capture
Press Ctrl+E to toggle capture. The magnifier icon in the toolbar shows a red cross when capture is running and a plain magnifier when it is paused. That icon is the only reliable answer to whether Procmon is currently recording, and it is worth checking every time you sit down at a new machine.
Auto-scroll is on by default, so new events appear at the bottom and the list scrolls constantly. That is fine during capture and annoying while reading, so pause before you start reading.
Ctrl+X clears the event list. It does not stop the driver, and it does not delete anything you have already saved. Backspace removes only the selected rows, which is the honest way to trim a capture down to the interesting part. Reproduce your one failing action while capture runs, note the clock time when it happened, then stop and read.
4. Filter the results by process and operation
Filtering is the skill that decides whether Procmon is usable. Press Ctrl+L for the Filter dialog, then work down the columns: Process Name, PID, Operation, Path, Result, User, and Session ID. Each has Include and Exclude options with a relation of is, is not, contains, begins with, ends with, matches regex or does not match regex.
Two rules save time. First, filtering by process name alone is almost never enough. Threads on diagnosing an explorer.exe hang show the classic failure over and over: the filter looks correct, the log is still a firehose, and the machine spends a quarter of its CPU generating events. Add an Operation or Path condition, or exclude the handful of processes you already know are chatty, and the trace becomes readable.
Second, multiple filters are combined with AND, not OR. Two Include rows for Process Name and Path narrow the result. To widen it, change the relation between them to Or in the Filter bar rather than adding more rows.
For the drop-down columns, click the arrow to pick from values Procmon has already seen in the current buffer. Pick from the list when the value exists, type manually when it does not. A PID that disappeared from the list still exists as text, but a mistyped path returns nothing and sends you hunting.
One more thing that trips people up: filters are non-destructive. They change what is displayed, not what is being captured, and not what gets written to the saved file unless you export only the filtered selection.
5. Search for a file, registry key, or network target
Ctrl+F opens search. Type a file name, a registry key path, or a DLL name and Procmon highlights every match and reports a count at the top of the window. Searching through half a million rows takes seconds.
Search highlights rather than filters, so the surrounding rows stay in context. That is usually what you want: the CreateFile that succeeded, followed by the ReadFile that did not. Use Find Next to walk match to match, and Ctrl+Shift+F to search the Detail column as well as the path.
While you search, check the Result column. A row showing NAME NOT FOUND for a DLL is not noise, it is the answer to why an application will not start. ACCESS DENIED points at permissions or integrity level. NAME NOT FOUND on a registry value tells you which key a program looked for and did not find, which is usually the whole story for a silent fallback.
6. Interpret the main event columns and results
The default columns are Time of Day, Process Name, PID, Operation, Path, Result and Detail. You will read Process Name, Operation, Path and Result for almost every investigation, and ignore Detail until something needs explaining.
Operation tells you what kind of call it was: CreateFile, ReadFile, WriteFile, SetSecurityDescriptor, RegOpenKey, RegQueryValue, Load Image, ConnectTCP. Path gives you the object. Result gives you the outcome, with SUCCESS meaning the call returned what it wanted.
Detail holds the arguments, which is where privacy trouble starts. It can contain file contents, command lines, full user names and occasionally credentials typed into a prompt. Treat every capture as sensitive and scrub it before it leaves your machine.
Double-click any row to open the event properties dialog. That view shows the full call stack and the process tree, which is the fastest route to understanding where an operation came from. Right-click the column headers to add or remove columns, then save your layout as a bookmark so the columns you care about are back after the next update.
7. Save, export, and document the evidence
Ctrl+S saves the whole buffer as a PML file, Process Monitor’s native format. PML keeps the full event data including stacks, and it is the only format you can load back into Procmon for further filtering. Save a copy before you start trimming anything, because CSV is one-way.
File then Export exports to CSV. You choose which columns to include, and you can export all events or only the highlighted selection. CSV is what you send to someone who does not have Procmon installed, and what you open in a spreadsheet when the question is simply how many times something happened.
Procmon keeps a Backing Files area for changes it made to your own configuration, including its Registry settings. If you enable boot logging and later want your system back the way it was, that area is where the original values live.
Write down the reproduction steps next to the log. A PML without a timestamped note of what you clicked is a wall of rows; a PML with one tells the whole story in a minute.
8. Capture activity during Windows startup
Slow boots, login hangs and services that never reach running cannot be debugged from inside Windows, because the problem happens before you can open the tool. Procmon handles this with boot logging, and support engineers ask for a boot trace as a standard diagnostic step.
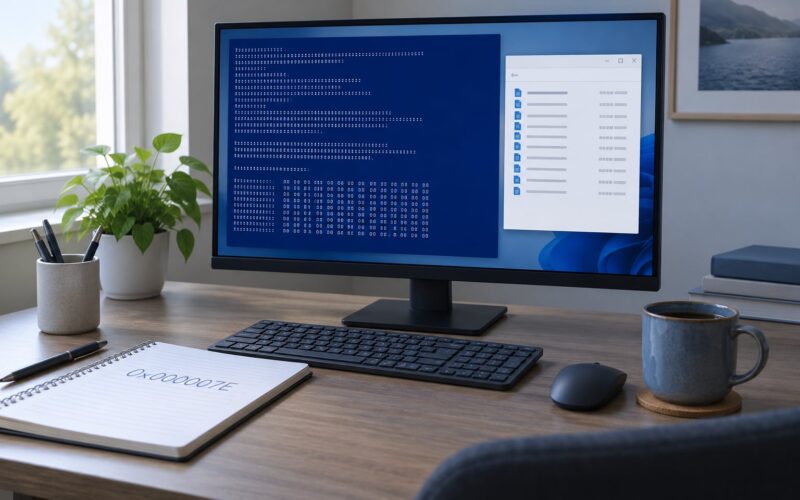
Open Options, tick Enable Boot Logging, and click OK. Procmon copies its driver PROCMON.SYS into C:WindowsSystem32drivers, schedules itself for the next boot, and asks to restart. On reboot the capture begins before Windows has finished starting, which is the only way to see what ran, in what order, and what failed.
After the machine settles, log in and open Procmon. The boot trace loads automatically, or you can open the file yourself from the Windows directory, where it is saved as PML_BOOT.PML. Filter it the same way as any other capture, then export the interesting range to CSV with File then Export.
Turn boot logging off again the moment you are done, by unticking Enable Boot Logging and restarting. Leaving it enabled means every boot from then on writes to disk until the machine runs out of space. Give yourself at least a couple of gigabytes free before you start.
9. Use Procmon from the command line
Procmon takes switches, which makes it usable on a machine with no interactive session, such as a build agent or a virtual machine you drive over WinRM.
procmon.exe /AcceptEula /Quiet /Minimized /BackingFile C:Logscapture.pml /Runtime 60 /WaitForIdle
procmon.exe /Terminate
The first line accepts the licence silently, runs without the splash screen, minimises itself, writes to a named backing file, waits for the system to go idle, and stops after 60 seconds. The second line shuts down an instance that is still running, which is the fix for the hidden background Procmon people find holding a driver open after the window was closed.
The switches worth remembering are /AcceptEula for unattended runs, /Quiet and /Minimized to avoid a window, /BackingFile to control where the PML lands, /Runtime in seconds, /WaitForIdle to hold off until the system settles, /OpenLog to open an existing PML, and /Terminate to stop a running instance.
Converting a PML on a machine where you cannot install anything is a two-step job: run the capture with /BackingFile, then copy the file somewhere with Procmon installed and export it to CSV. Wrapping those two calls in PowerShell is how I do repeat captures across a list of machines, but keep the filter step in between, otherwise you will end up with gigabytes of unreadable CSV.
| Shortcut | Action | Menu path |
|---|---|---|
| Ctrl+E | Toggle capture on or off | File, Capture |
| Ctrl+L | Open the Filter dialog | Filter, Filter |
| Ctrl+F | Search the capture | Search, Find |
| Ctrl+X | Clear the event list | File, Clear |
| Ctrl+S | Save the capture as a PML file | File, Save As |
| Ctrl+D | View the event properties dialog | View, Event Properties |
| Ctrl+Down | Focus the process tree | View, Process Tree |
| Ctrl+J | Jump to a process, file or registry key | Search, Jump To |
| Backspace | Delete the selected events | Edit, Delete Events |
| Ctrl+/ | Show or hide the Process Monitor Filter bar | Filter, Filter Bar |
Common Mistakes
Almost every bad first experience with Procmon comes from one of the same handful of mistakes.
- Not running elevated. The trace looks busy but quietly misses most system activity. Close it, right-click Procmon.exe, Run as administrator, and capture again.
- Leaving capture running. Once you walk away from the machine with capture on, the log grows without limit. Ctrl+E before you get up, and check the magnifier icon when you sit back down.
- Expecting filters to slow the capture. Filters only change the display. The driver keeps recording, which is why the process still shows CPU usage. For noise control, switch off categories in the Events menu or write only selected events to a backing file.
- Filtering by process name alone. Process-specific noise still floods the view, especially for processes such as explorer.exe. Add an Operation or Path condition, or exclude the known chatty processes before you start.
- Leaving the first-run filter dialog untouched without reading it. The shipped defaults are sensible. Anything you add on top of them should be deliberate.
- Ignoring Result. A trace full of NAME NOT FOUND and ACCESS DENIED rows is not a broken capture, it is the finding. These are the rows that explain a missing DLL or a service that will not start.
- Leaving boot logging enabled. One forgotten tick and every subsequent boot writes a PML until the disk fills. Untick Enable Boot Logging and restart when the trace is done.
- Sharing logs without scrubbing. The Detail column can contain command lines with passwords, user names and file contents. Open the file before you attach it anywhere.
Two habits cover most of the list. Capture for the shortest window that lets you reproduce the fault, and record the wall clock time of the failure so you can jump straight to that part of the trace.
On thread stacks, expect a wall of “symbols not found” until you point Procmon at a symbol server. Options then Symbol Server accepts a semicolon-separated list, and Microsoft’s public server at symbols.symsrv.com is the usual first entry. Once symbols resolve, the stack shows function names instead of addresses and the call chain usually answers the question in one look.
Procmon vs Process Explorer vs Process Hacker vs Sysmon
Procmon and Process Explorer are not the same tool, and choosing the wrong one is the most common reason people give up on it. Procmon records a history of activity, Process Explorer shows the current state of a live system, and Sysmon is the one that keeps logging when nobody is watching.
| Tool | Shows | Output | Reach for it when |
|---|---|---|---|
| Process Monitor (Procmon) | File system, Registry, process, thread and socket events over time | Live event list, PML, CSV | You need to know what happened and in what order |
| Process Explorer | Live process, thread, handle and DLL state, plus a process tree | Live view, system information | You need to know what is running right now |
| Process Hacker | Same live view as Process Explorer, plus services and security features | Live view | You want the extra service and token controls in one place |
| Sysmon | Similar events written to the Windows Event Log, persistently | Event log channels, XML | You need days of history without anyone running a GUI |
The two can sit side by side in one session. Use Process Explorer to see that a process is hung, then switch to Procmon to find the file it was waiting on. For a file that is locked and you cannot identify the owner, Procmon’s Path filter is faster than hunting handles.
Frequently Asked Questions
What is Procmon in Windows?
Procmon, short for Process Monitor, is a free Microsoft Sysinternals utility that shows file system, Registry, process, thread and network socket activity on a Windows machine in real time. It combines the old Filemon and Regmon tools into one program that streams events from a kernel driver into a filterable list you can save as a PML file or export to CSV. It runs on Windows 11 and Windows Server 2019 or later.
Do I need to run Procmon as administrator?
Yes, in almost every case. Without elevation you see a partial trace: many system services, other users’ processes and most protected Registry activity are missing, and you can waste an hour chasing a problem that was never captured. Right-click Procmon.exe, choose Run as administrator and accept the UAC prompt. An empty-looking log or rows that stop at a certain depth is the classic symptom of running it unelevated.
Is Procmon the same as Process Explorer?
No, they answer different questions. Process Monitor keeps a timestamped history of what happened: which process opened a file, which registry key it queried, whether the call succeeded. Process Explorer shows the current live state of processes, threads, handles and loaded DLLs, with no history. Procmon is for cause, Process Explorer is for current state, and using them together is common.
How do I know if Procmon is running or capturing?
Look at the magnifier icon on the toolbar. A plain magnifier means capture is paused, and a magnifier with a red cross means it is recording. Ctrl+E toggles between the two. For an instance that is running without a visible window, run procmon.exe with the /Terminate switch from an elevated prompt; that closes the background instance and unloads its driver.
Why does my Procmon log fill up so fast, and how do I cut the noise?
On a busy system Procmon records tens of thousands of events per second, so an unfiltered buffer becomes unreadable almost immediately. Cut the noise with Events menu categories rather than filters, since filters change only the display. Turn off Load Image and any profiling you do not need, filter on Process Name plus Operation, exclude the few processes you know are chatty, and keep captures to seconds rather than minutes.
How do I find the boot log and where does PML_BOOT.PML end up?
Enable Options then Enable Boot Logging, let Procmon copy PROCMON.SYS into C:u005cWindowsu005cSystem32u005cdrivers and restart when prompted. The next time you log in, the trace opens automatically, and the file itself is saved as PML_BOOT.PML in the Windows directory. To read it later, open that file with Procmon and use File then Export to convert it to CSV. Remember to untick Enable Boot Logging when you are finished.
Conclusion
Start by installing Process Monitor, running it as administrator, and toggling capture with Ctrl+E while you watch the magnifier icon. Then reproduce one specific failure, note the time, and filter to the one process and operation involved. That loop, capture, filter, save, is the whole workflow.
Everything else, boot logging, thread stacks, command-line switches, exists to serve it. Get comfortable with a short focused capture before you need any of the advanced parts, and check the Result column before you conclude anything.